


Procedure to notice that the data reaching a deployed model no longer looks like the data it was trained on. The endpoint saves every request, a monitor compares them with the training data column by column and flags the columns that have moved. A .NET console first sends flowers similar to the training ones, then flowers with petals 50% longer.
You need: the mlw-guide-extranet-01 workspace with the iris-model model registered in version 2, that is steps 1 to 8 of the guide Train a neural network on Azure Machine Learning and call it from .NET, Python with scikit-learn and .NET 10 on your computer.
Time: about three hours, most of it waiting: in the test the deployment took 25 minutes and the monitor check an hour and a half.
Cost: a few dollars, if you delete the resources at the end. The studio shows 0.12 dollars an hour for the endpoint machine and 0.55 dollars an hour for each of the check machines.
The studio in the screenshots is in English: command names are written as they appear on screen.
The reference data
1. Prepare the folder
The monitor compares the requests with a reference table: the 105 rows used for training, split as in the script of the starting guide. Create riferimento.py:
from pathlib import Path
from sklearn.datasets import load_iris
from sklearn.model_selection import train_test_split

iris = load_iris(as_frame=True)
features = iris.data
features.columns = ["sepal_length", "sepal_width", "petal_length", "petal_width"]
x_train, _, _, _ = train_test_split(
    features, iris.target, test_size=0.3, random_state=42, stratify=iris.target)

folder = Path("iris-reference")
folder.mkdir(exist_ok=True)
x_train.to_csv(folder / "iris.csv", index=False)
(folder / "MLTable").write_text("""paths:
  - file: ./iris.csv
transformations:
  - read_delimited:
      delimiter: ","
      header: all_files_same_headers
""")
Run python riferimento.py. It creates the iris-reference folder with iris.csv and MLTable, the file that tells Azure how to read the table.
2. Register the table
In the studio open Data > Create and fill in:
- Name:
iris-reference - Type: Table (mltable)
Press Next, choose From local files, then the proposed store, workspaceblobstore. Press Upload folder and choose the iris-reference folder.
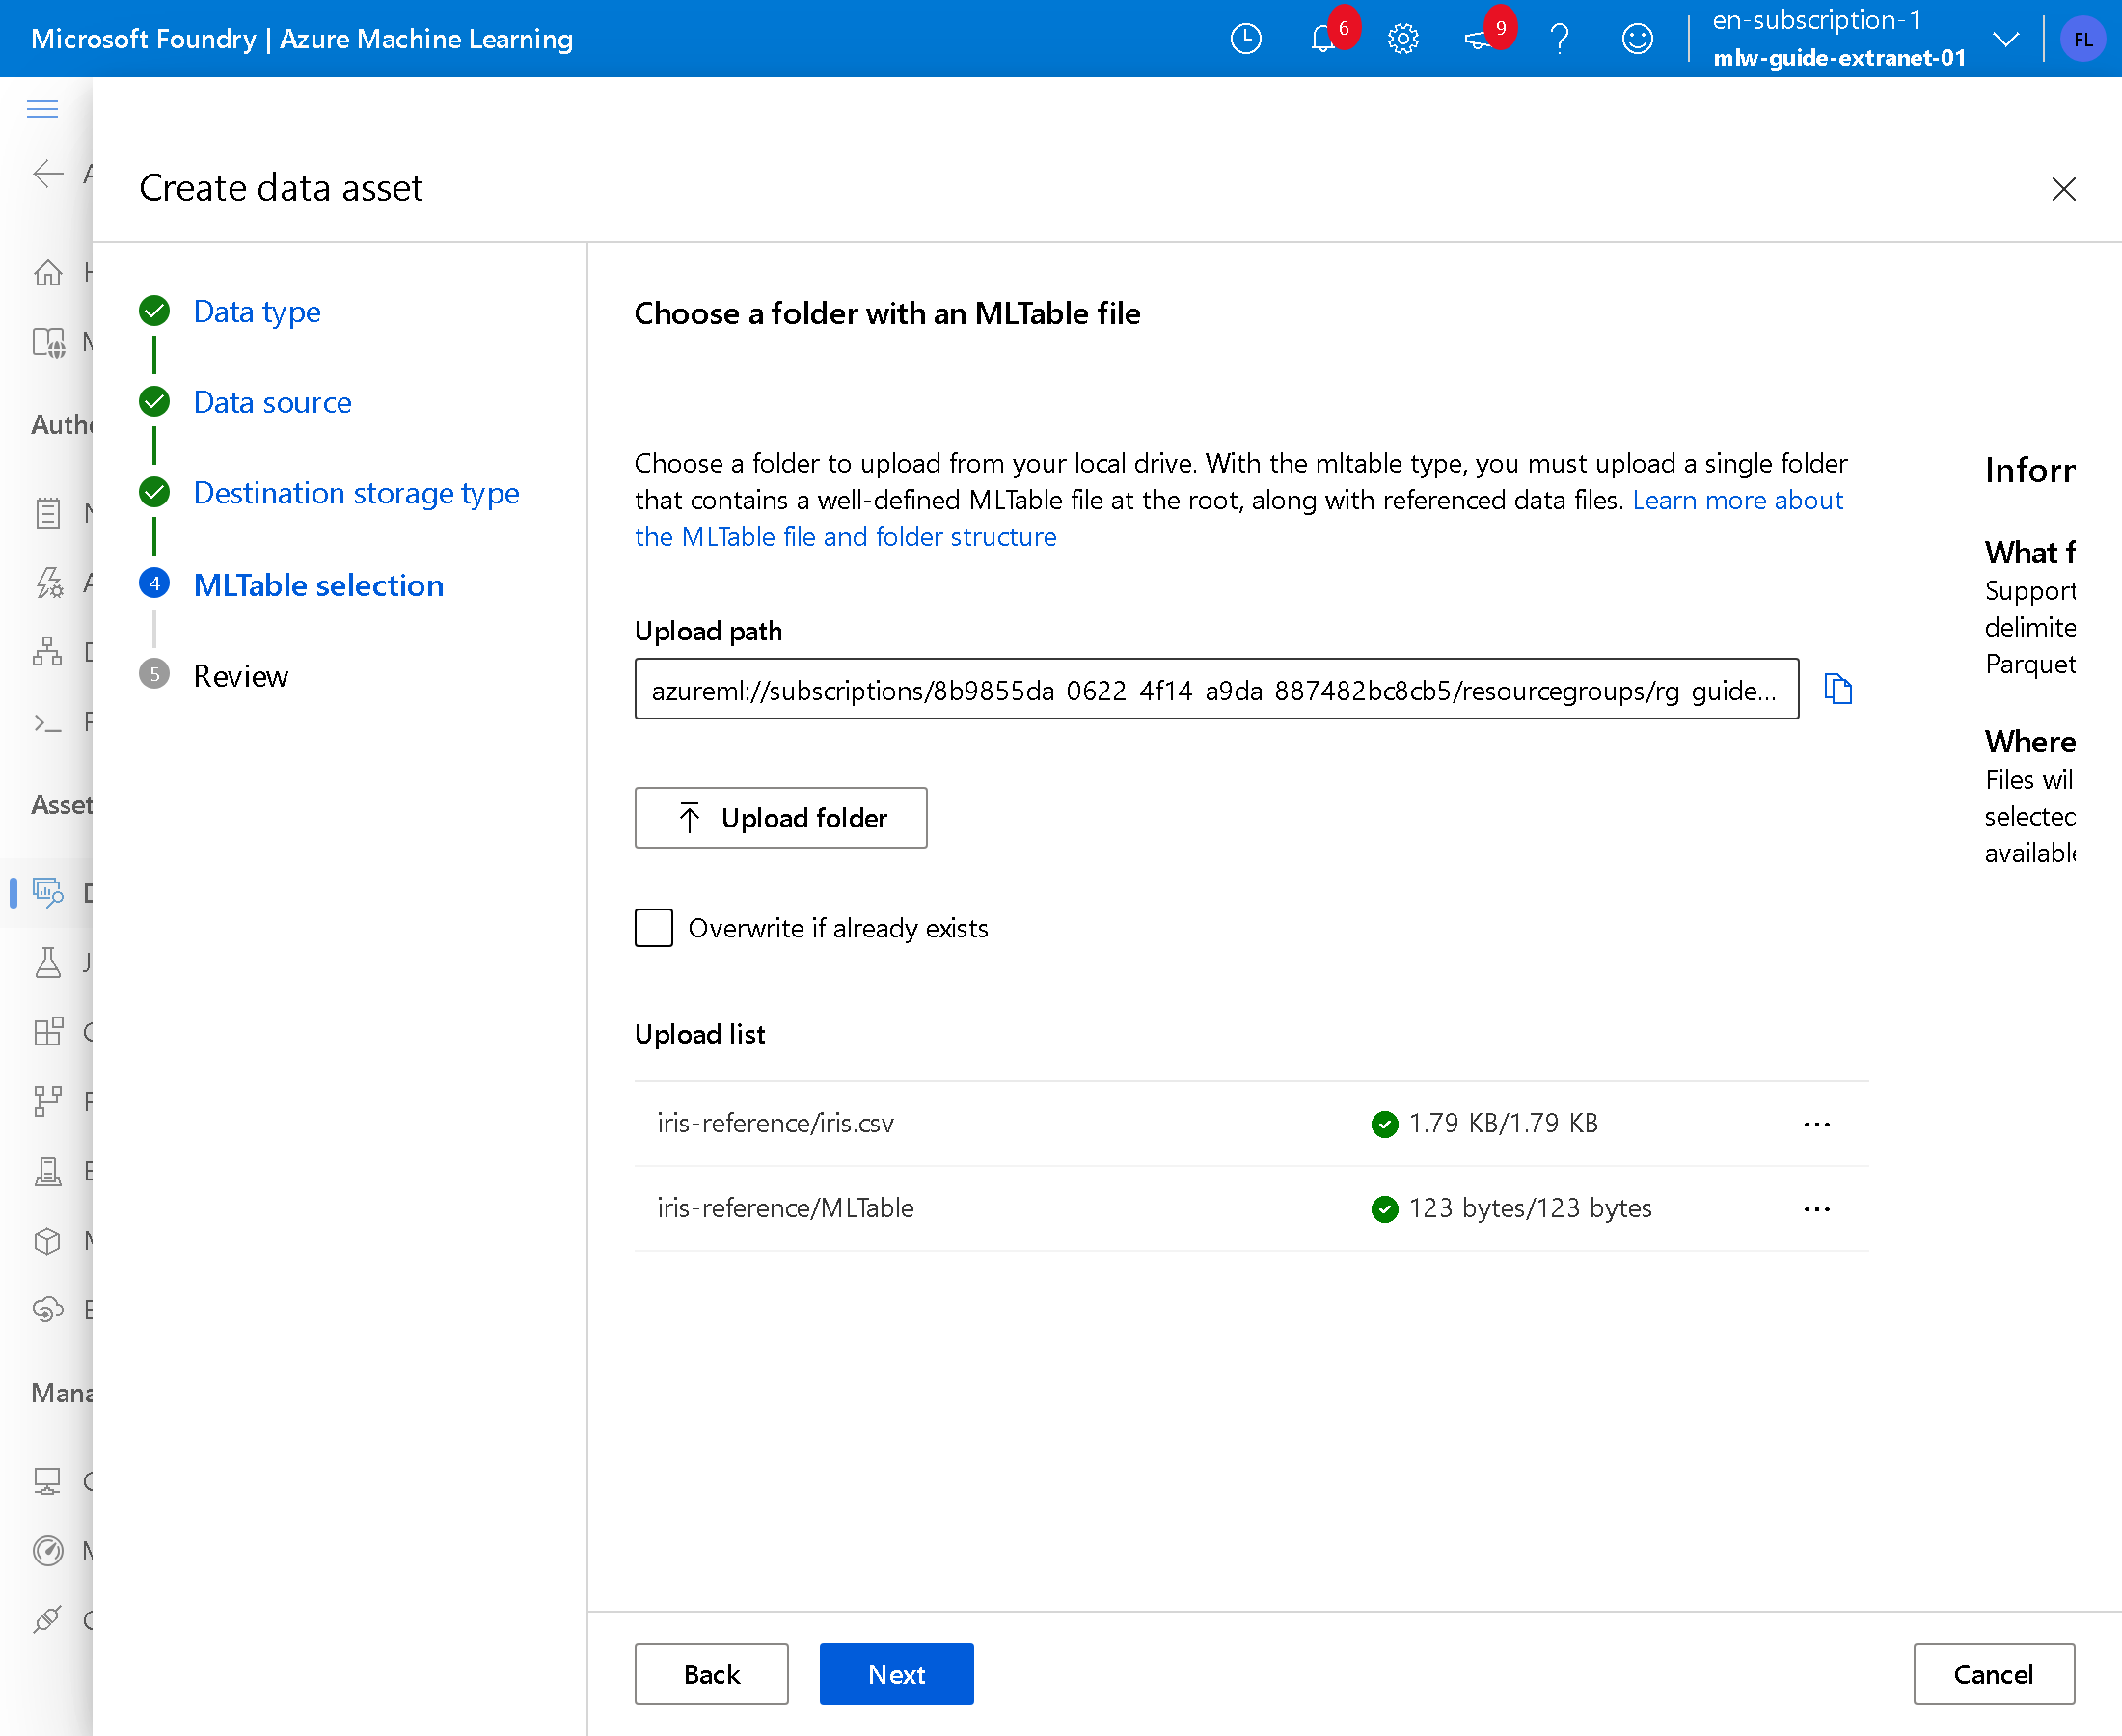
Press Next and Create.
The requests to check
3. Deploy the model with data collection
Open Models > iris-model, version 2, press Use this model > Real-time endpoint and fill in:
- Instance count:
1 - Virtual machine:
Standard_D2as_v4, the proposed one - Endpoint: New
- Endpoint name: a name of your own, unique in the region, here
iris-drift-extranet-01 - Deployment name:
main - Inferencing data collection: Enabled
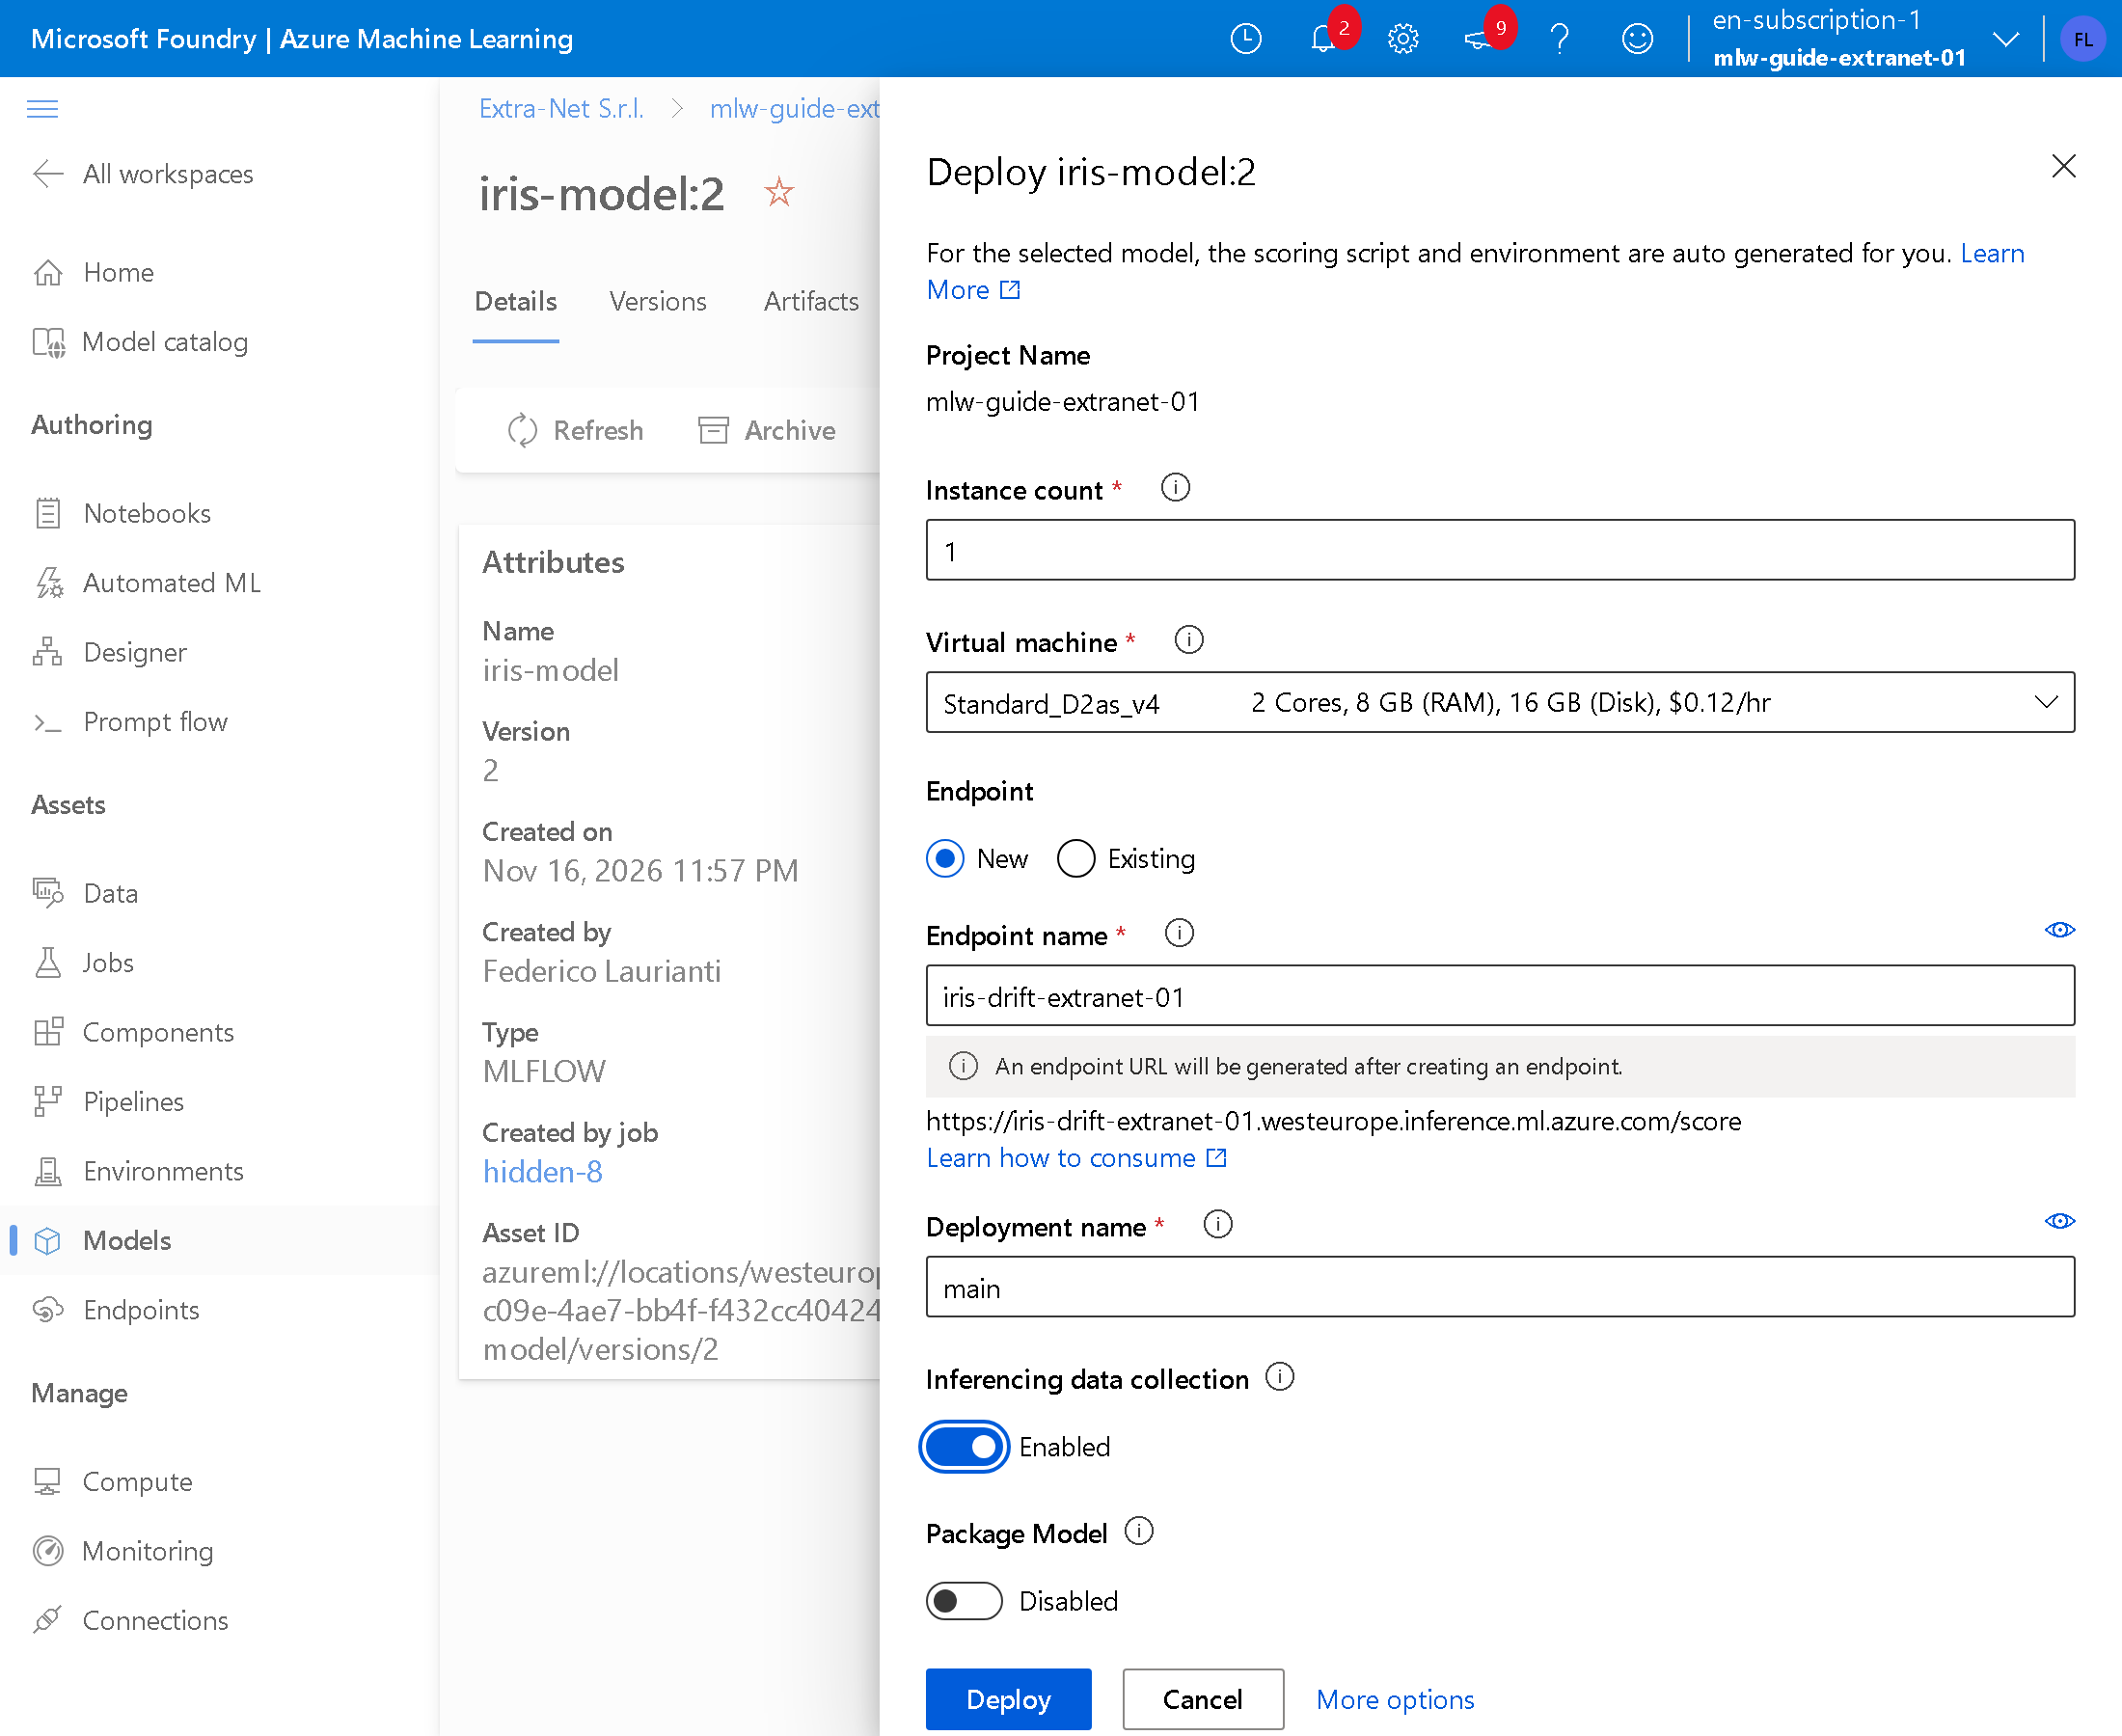
Press Deploy. With collection on, the endpoint saves every request and every response: iris-drift-extranet-01-main-model_inputs and iris-drift-extranet-01-main-model_outputs appear in Data.
4. Copy the address and the key
In Endpoints > iris-drift-extranet-01, Consume tab, copy REST endpoint and Primary key. The key gives access to the model: do not write it in the code and do not publish it.
5. Create the console
dotnet new console -n iris-drift
cd iris-drift
Replace Program.cs. It sends 30 requests of 10 flowers, made up from the mean and deviation of the measures of the three species. With an argument it multiplies petal length and width by that number.
using System.Net.Http.Headers;
using System.Net.Http.Json;

string scoringUri = Environment.GetEnvironmentVariable("SCORING_URI")!;
string key = Environment.GetEnvironmentVariable("ENDPOINT_KEY")!;
double petalFactor = args.Length > 0 ? double.Parse(args[0], System.Globalization.CultureInfo.InvariantCulture) : 1.0;

// average measures and standard deviation of the three species, in cm
double[][] means = [[5.0, 3.4, 1.5, 0.2], [5.9, 2.8, 4.3, 1.3], [6.6, 3.0, 5.6, 2.0]];
double[][] deviations = [[0.35, 0.38, 0.17, 0.11], [0.52, 0.31, 0.47, 0.20], [0.64, 0.32, 0.55, 0.27]];

Random random = new(42);
double Normal(double mean, double deviation) =>
    mean + deviation * Math.Sqrt(-2 * Math.Log(1 - random.NextDouble())) * Math.Cos(2 * Math.PI * random.NextDouble());

using HttpClient http = new();
http.DefaultRequestHeaders.Authorization = new AuthenticationHeaderValue("Bearer", key);

int sent = 0;
for (int request = 0; request < 30; request++)
{
    double[][] flowers = new double[10][];
    for (int i = 0; i < flowers.Length; i++)
    {
        int species = random.Next(3);
        double[] f = new double[4];
        for (int c = 0; c < 4; c++)
        {
            f[c] = Math.Round(Math.Max(0.1, Normal(means[species][c], deviations[species][c])), 1);
        }
        f[2] = Math.Round(f[2] * petalFactor, 1);
        f[3] = Math.Round(f[3] * petalFactor, 1);
        flowers[i] = f;
    }

    var body = new
    {
        input_data = new
        {
            columns = new[] { "sepal_length", "sepal_width", "petal_length", "petal_width" },
            index = Enumerable.Range(0, flowers.Length).ToArray(),
            data = flowers,
        },
    };

    using HttpResponseMessage response = await http.PostAsJsonAsync(scoringUri, body);
    response.EnsureSuccessStatusCode();
    sent += flowers.Length;
}

Console.WriteLine($"{sent} flowers sent, petal factor {petalFactor}");
6. Send normal flowers and shifted flowers
Set the two variables with the copied values and run:
export SCORING_URI=https://iris-drift-extranet-01.westeurope.inference.ml.azure.com/score
export ENDPOINT_KEY=<key>
dotnet run
dotnet run -- 1.5
In PowerShell the first two lines are $env:SCORING_URI = "..." and $env:ENDPOINT_KEY = "...". In the test:
300 flowers sent, petal factor 1
300 flowers sent, petal factor 1.5
The first round imitates the training data; the second has petals 50% longer and wider, as if measures of a variety the model has never seen were arriving.
The monitor
7. Create the monitor
Open Monitoring > Add and fill in:
- Select model:
iris-model, version 2 - Select deployment with data collection enabled:
iris-drift-extranet-01/main - Select training data:
iris-reference:1, from Search for data - Model task type: Classification
- Monitor name:
iris-drift-monitor - Virtual machine size:
Standard_E4s_v3, the proposed one
At the bottom choose when the check runs. In the test Cron expression with 0 * * * *, that is every hour; the time is in UTC.
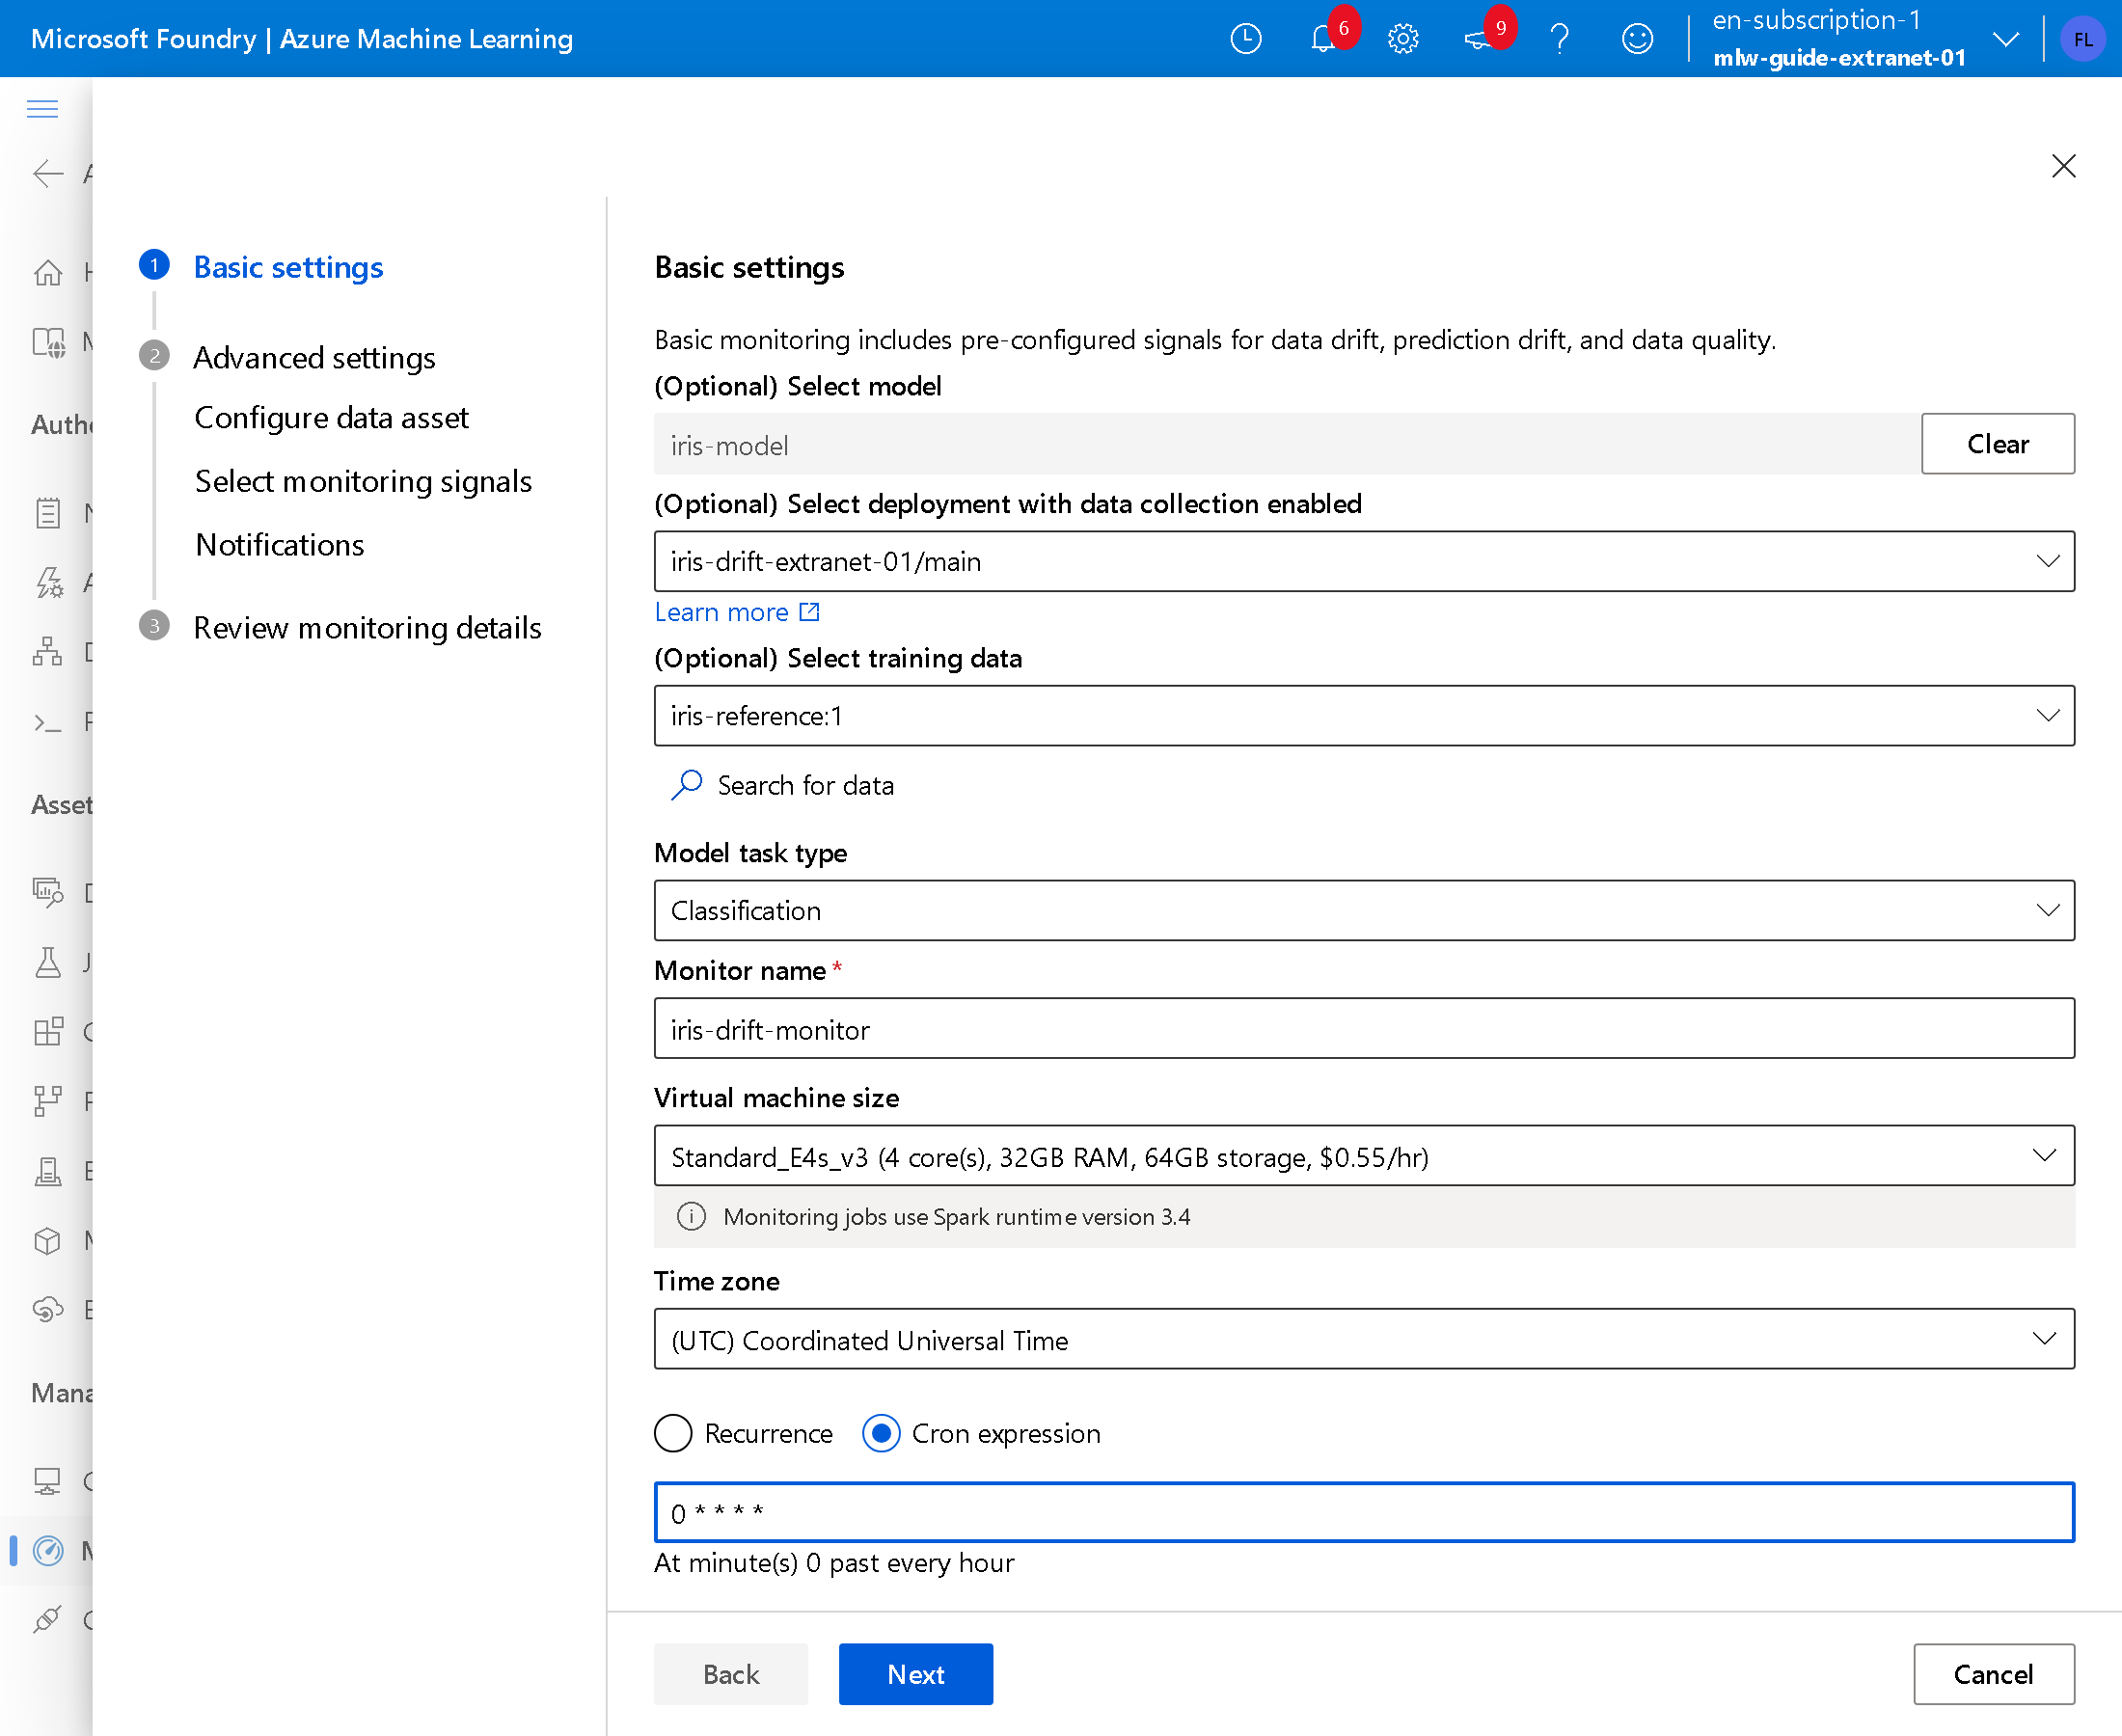
Press Next. In Configure data asset the studio has already added the three tables: press Next.
8. Keep only the drift signal
In Select monitoring signals the studio proposes four signals. In the test, with all four, Next stayed disabled: remove all but data-drift-signal with Delete.
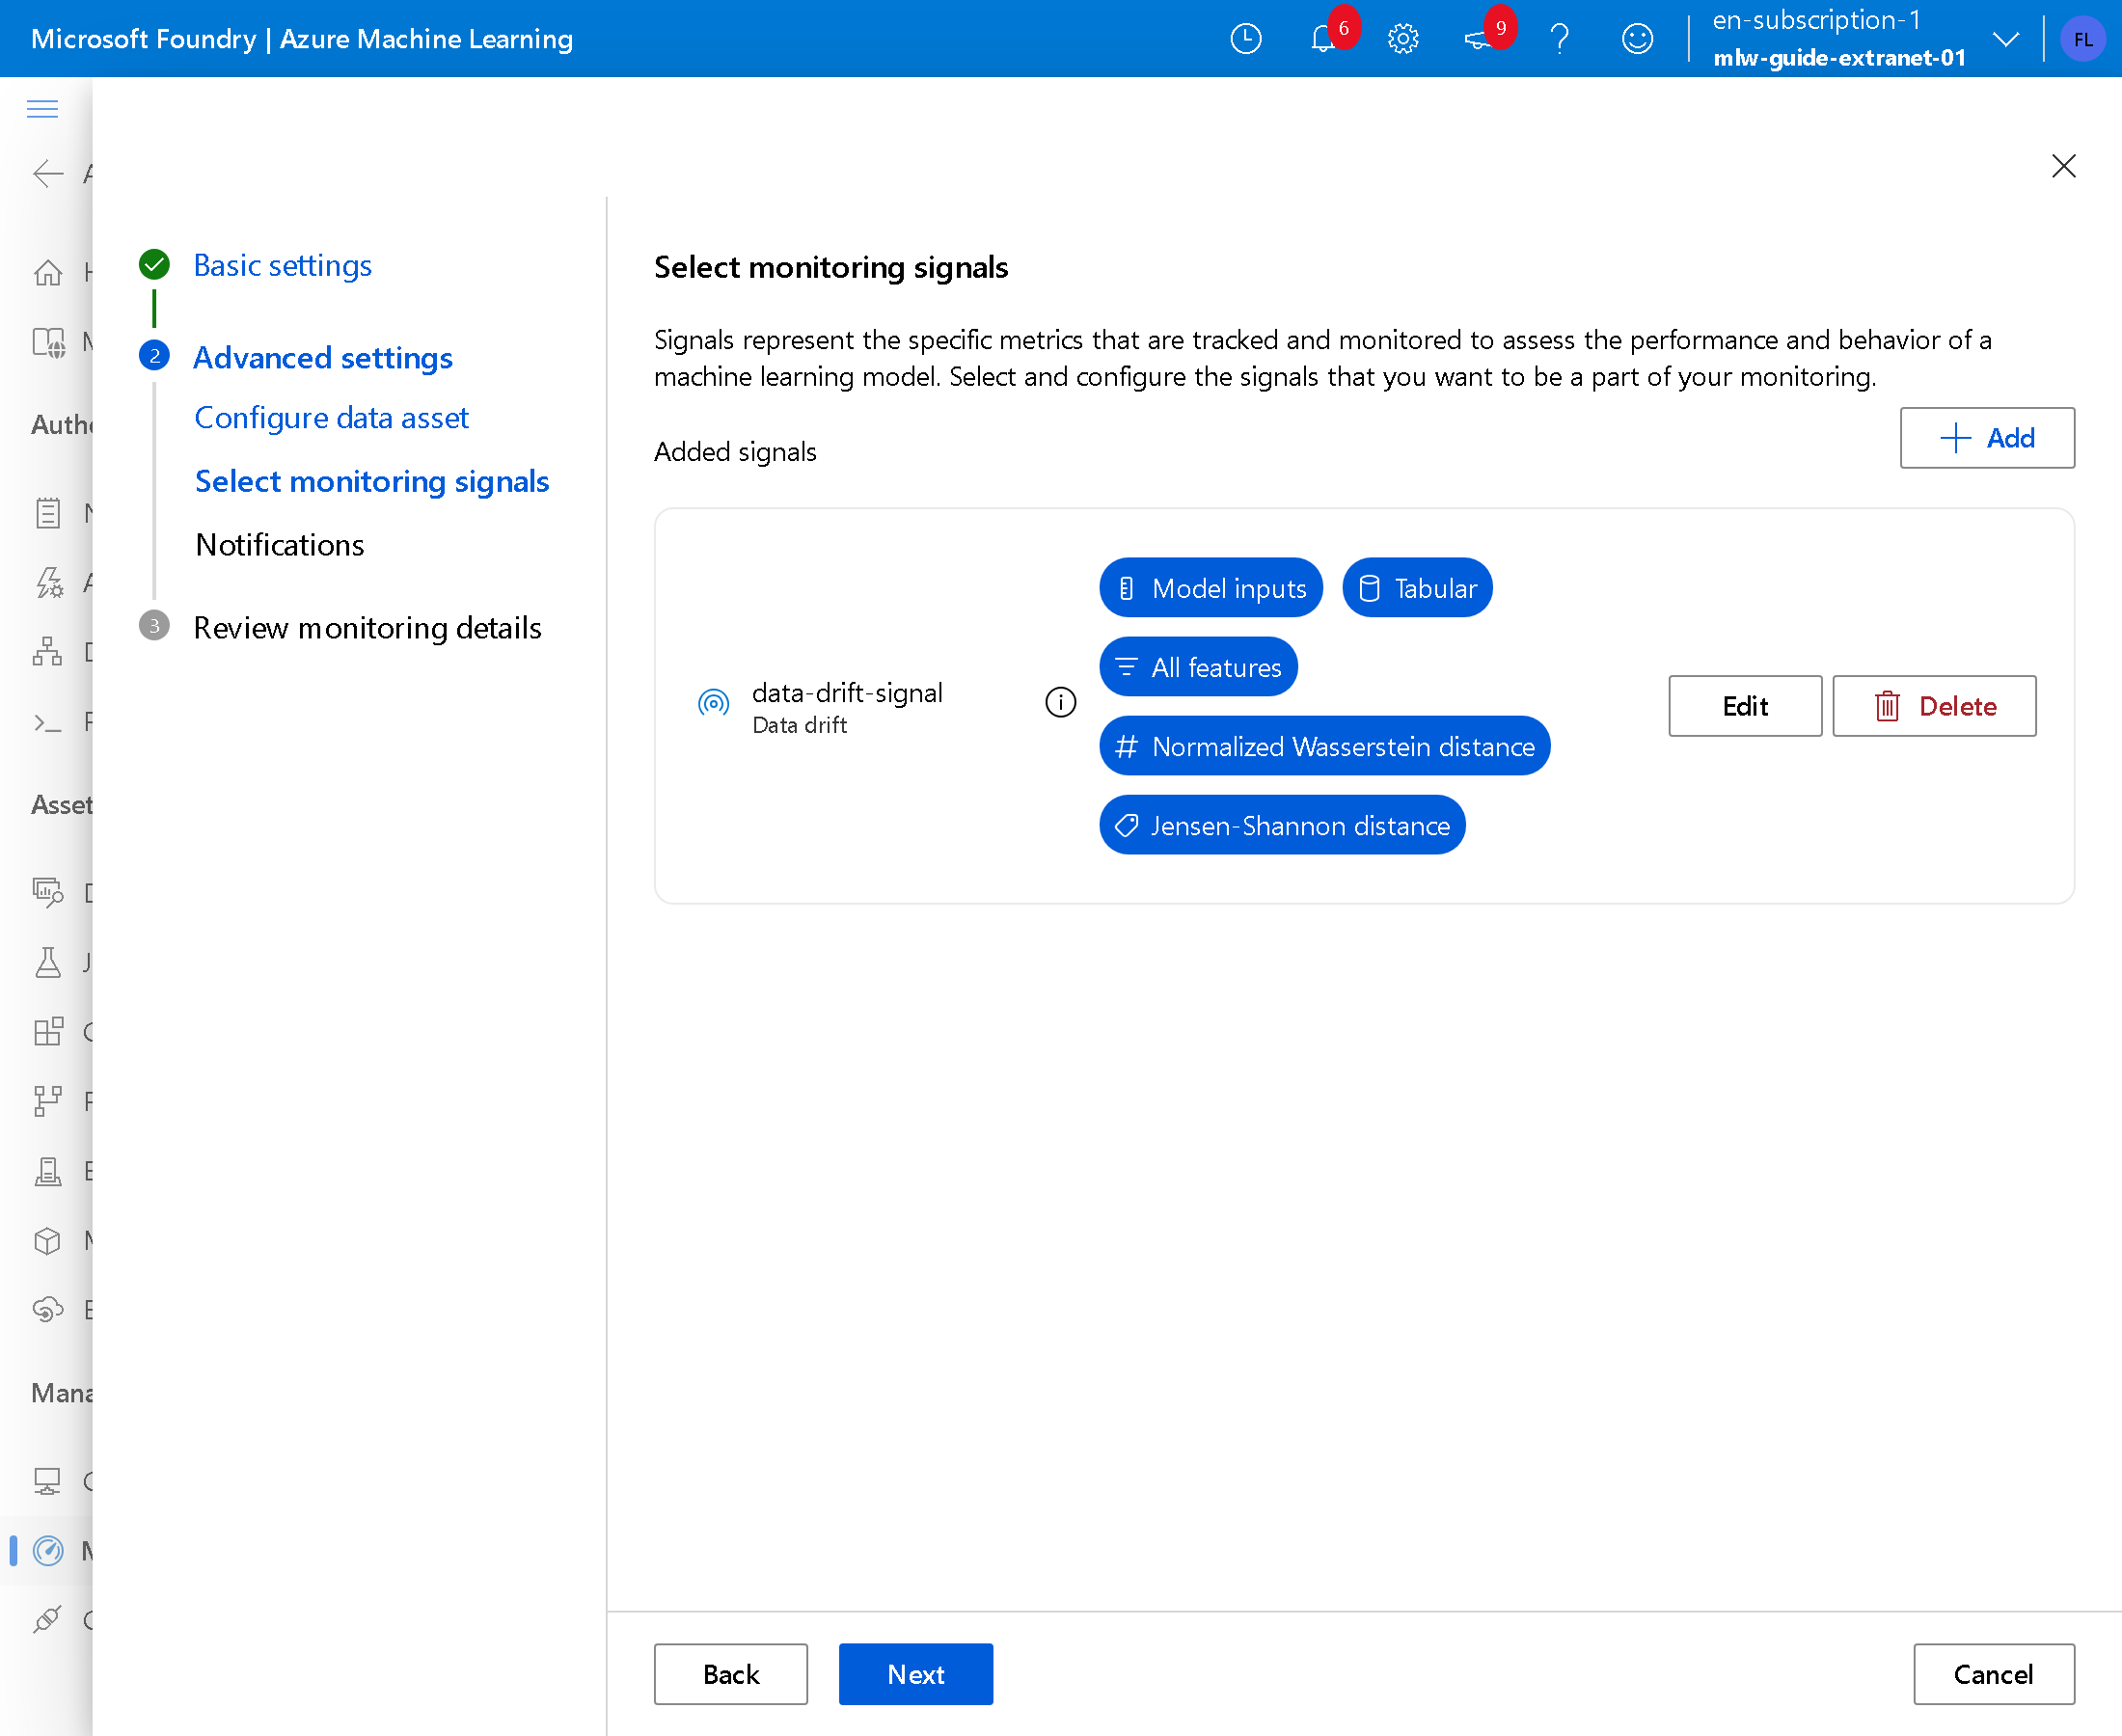
The signal compares the columns of the requests with the reference ones: for numbers it uses the normalized Wasserstein distance, with a 0.1 threshold. Press Next, in Notifications write the address that receives the alerts, press Next and Create.
9. Free the quota
The check runs on Spark and asks for up to five 4-core Standard_E4s_v3 machines, 20 cores in all. In the test the subscription had 20 cores for Azure Machine Learning in West Europe, and 4 were taken by the endpoint: the check stayed queued for hours, with the message This job is waiting for available quota in scheduling queue. From the studio Quota page the increase for the ESv3 family was refused.
The requests are already saved since step 3, so the endpoint is no longer needed. In Endpoints > iris-drift-extranet-01, Details tab, press Update traffic, write 0 for main and press Update; then, in the Deployment main box, press the bin icon, tick Delete deployment: main and press Delete.
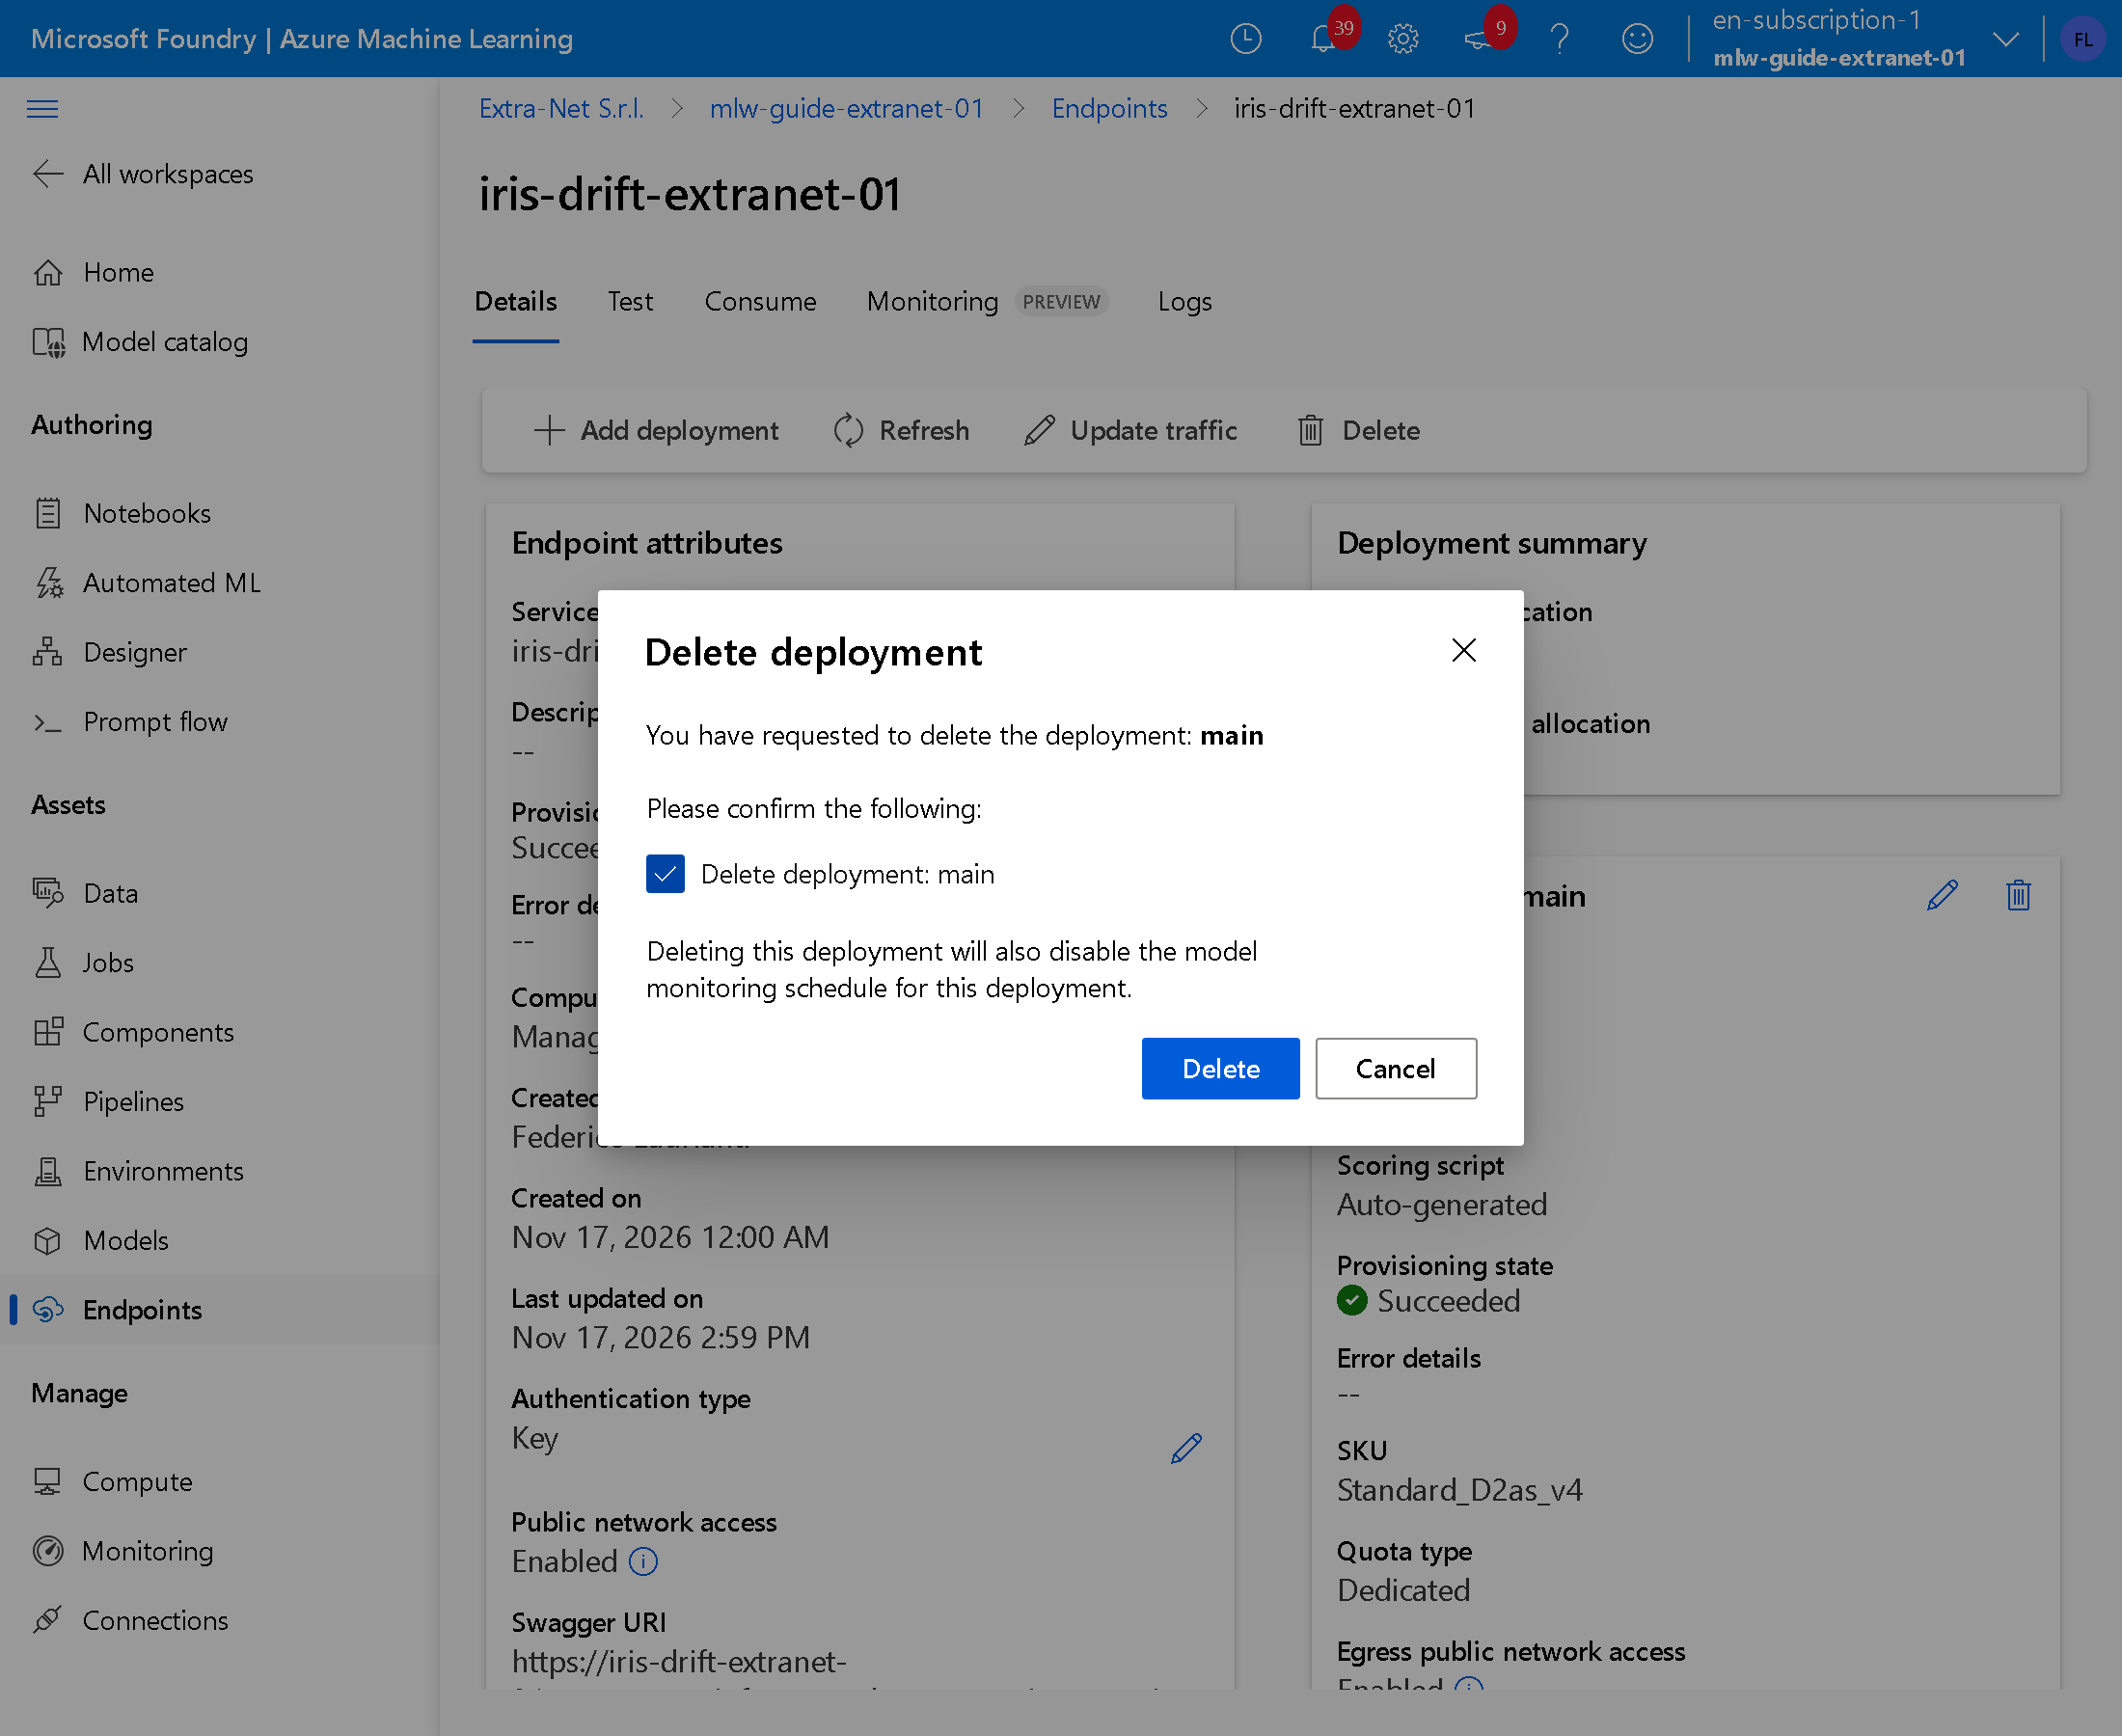
The confirmation warns that the deletion also turns off the monitor.
10. Start the check
In Monitoring tick iris-drift-monitor and press Enable, then Trigger manually and Submit. The check starts at once, without waiting for the hour. In the test it took an hour and a half.
The result
11. Read the drift
Open iris-drift-monitor. The Signals box shows how many columns exceed the threshold; Notifications lists the alerts.
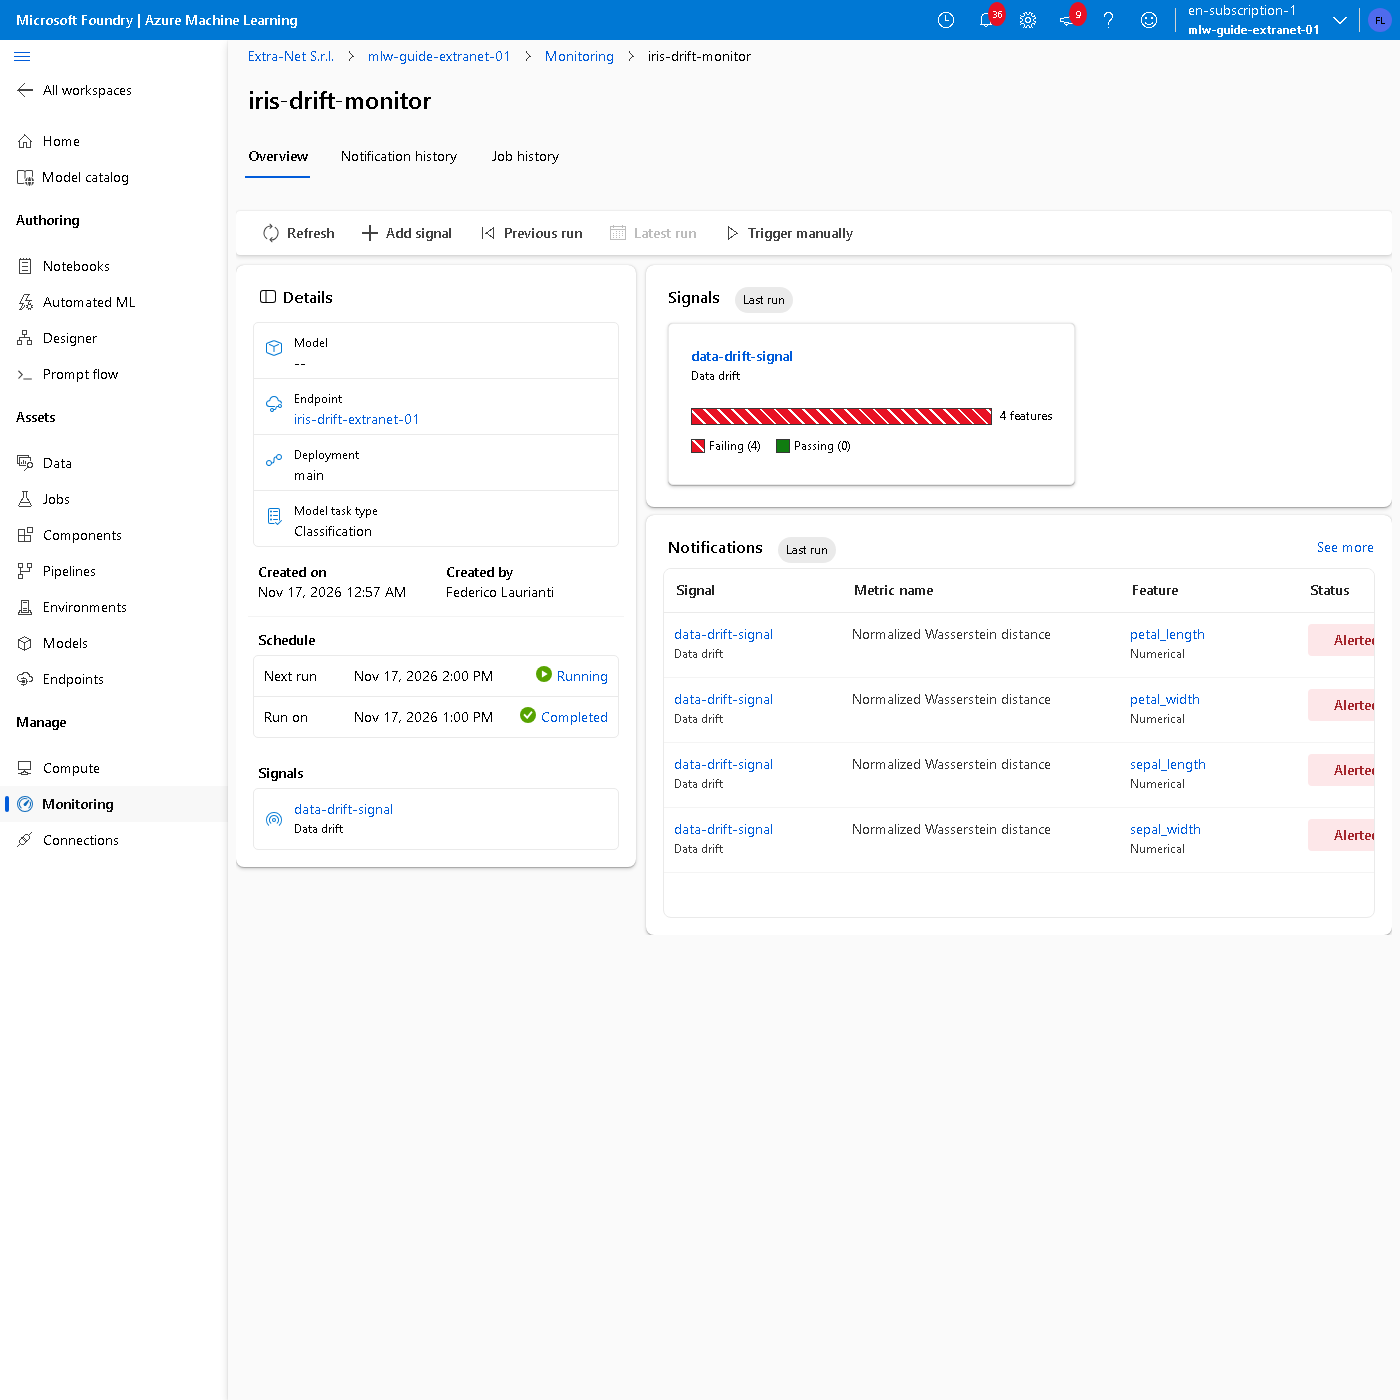
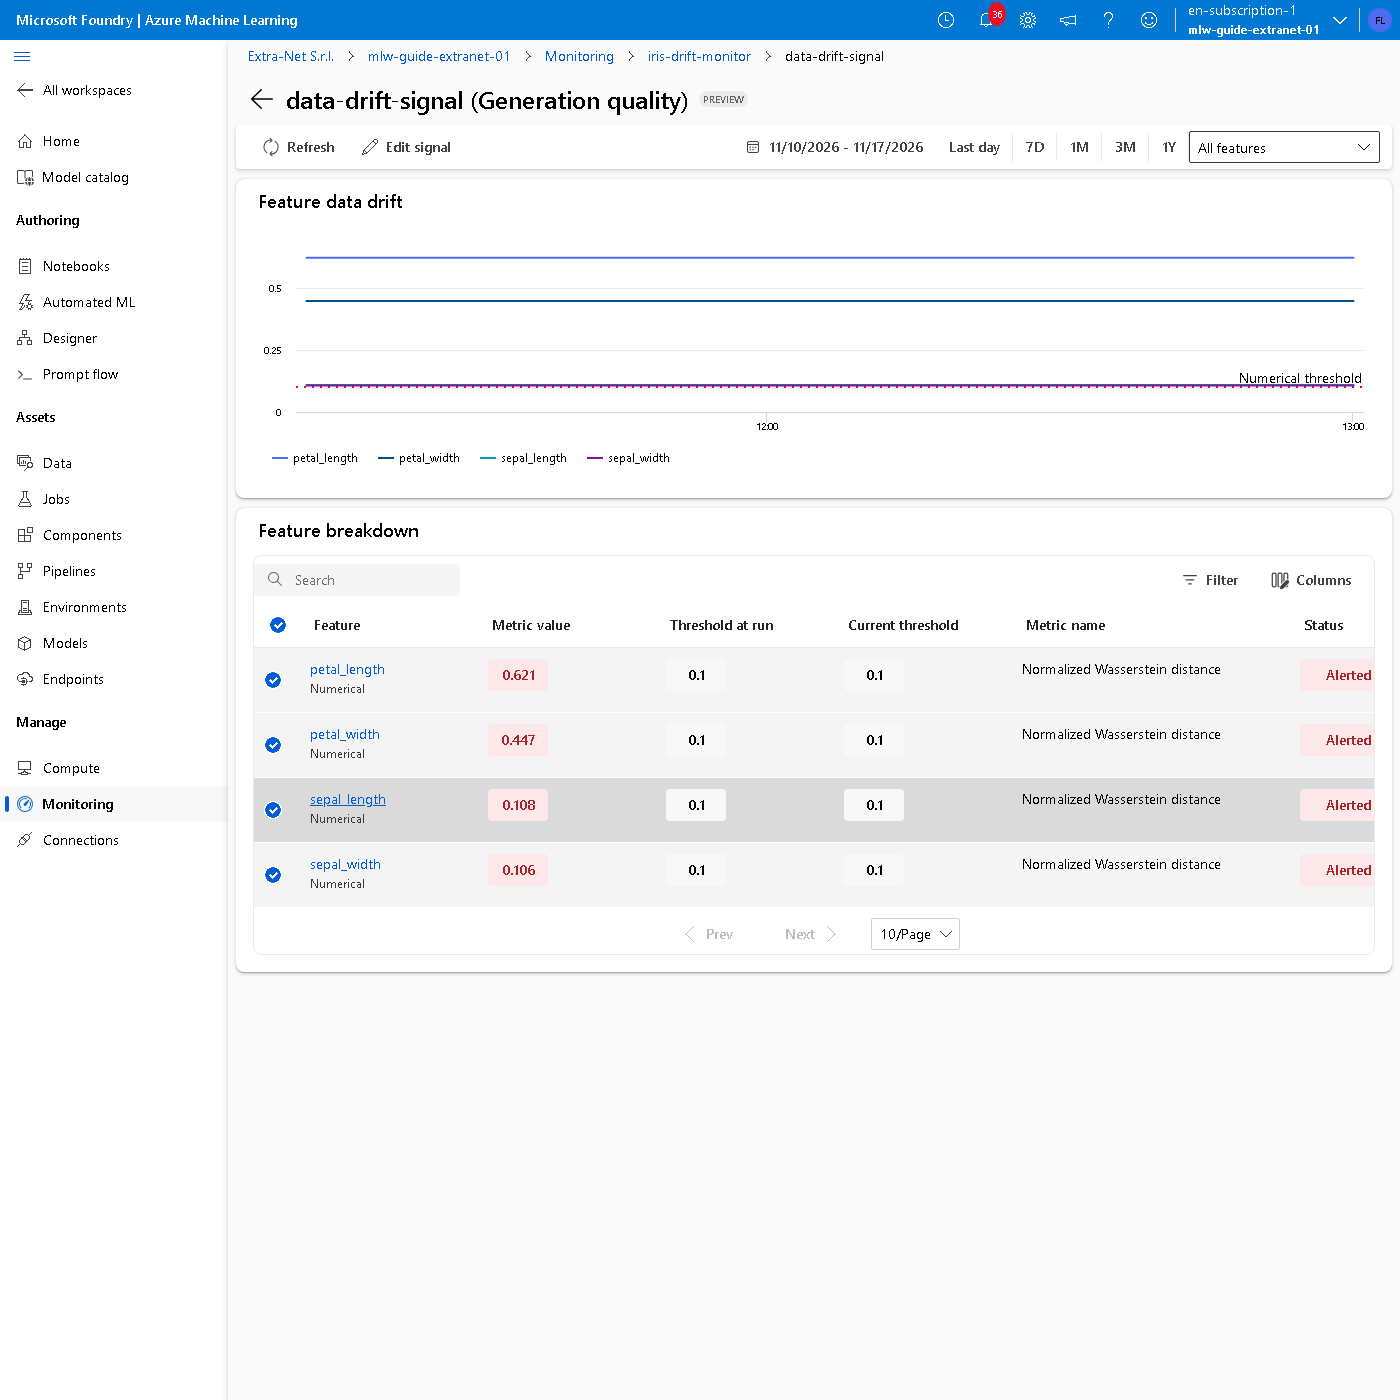
Press data-drift-signal for the distance of each column. In the test:
| Column | Distance |
|---|---|
petal_length |
0.621 |
petal_width |
0.447 |
sepal_length |
0.108 |
sepal_width |
0.106 |
The petals, shifted by 50% in half of the requests, exceed the threshold many times over. The sepals, left untouched, exceed it barely: they are the flowers made up by the console, which do not fully resemble the real ones. The threshold has to be tuned on your own data and is changed with Edit signal: at 0.15, the sepal distances of the test would stay below it.
12. Turn off the monitor
In Monitoring tick iris-drift-monitor, press Disable and confirm. Once off, it starts no more paid checks.
Delete the resources
13. Delete the group
Delete the rg-guide-ml-01 group as in step 13 of the starting guide.
14. Permanently delete the workspace
On the portal search for Azure Machine Learning, press Recently deleted, choose the subscription and, in Location, West Europe. Tick mlw-guide-extranet-01 and press Permanently delete, as in step 14 of the starting guide. Without this step, for 14 days you cannot create a workspace with the same name.
Command names, screenshots and results recorded on November 17, 2026, West Europe region, with .NET 10.