


Procedure to know when a deployed model starts answering with errors, and why. The endpoint sends its logs to Log Analytics, an Azure Monitor rule checks the 4xx responses every minute and sends an email, and a query on the logs finds the cause. A .NET console imitates a faulty client that forgets one of the four measures of the flower.
You need: the mlw-guide-extranet-01 workspace with the iris-model model registered in version 2, that is steps 1 to 8 of the guide Train a neural network on Azure Machine Learning and call it from .NET, and .NET 10 on your computer.
Time: about an hour, half of it waiting for the model deployment.
Cost: less than one dollar, if you delete the resources at the end. The studio shows 0.12 dollars an hour for the endpoint machine; the portal shows 0.10 dollars a month for the alert rule.
The portal in the screenshots is in English: command names are written as they appear on screen.
The endpoint and its logs
1. Deploy the model
In the studio open Models > iris-model, version 2, press Use this model > Real-time endpoint and fill in:
- Instance count:
1 - Virtual machine:
Standard_D2as_v4, the proposed one - Endpoint: New
- Endpoint name: a name of your own, unique in the region, here
iris-alert-extranet-01 - Deployment name:
blue
Press Deploy. In Endpoints > iris-alert-extranet-01, Consume tab, copy REST endpoint and Primary key. The key gives access to the model: do not write it in the code and do not publish it.
2. Send the logs to Log Analytics
On the Azure portal open the endpoint: search for iris-alert-extranet-01, of type Machine learning online endpoint. In the menu press Monitoring > Diagnostic settings > Add diagnostic setting and fill in:
- Diagnostic setting name:
iris-alert-logs - Categories:
AmlOnlineEndpointConsoleLogandAmlOnlineEndpointTrafficLog - Send to Log Analytics workspace: the Log Analytics workspace created with the Azure Machine Learning one, in the
rg-guide-ml-01group; its name starts withmlwguidelogalyti
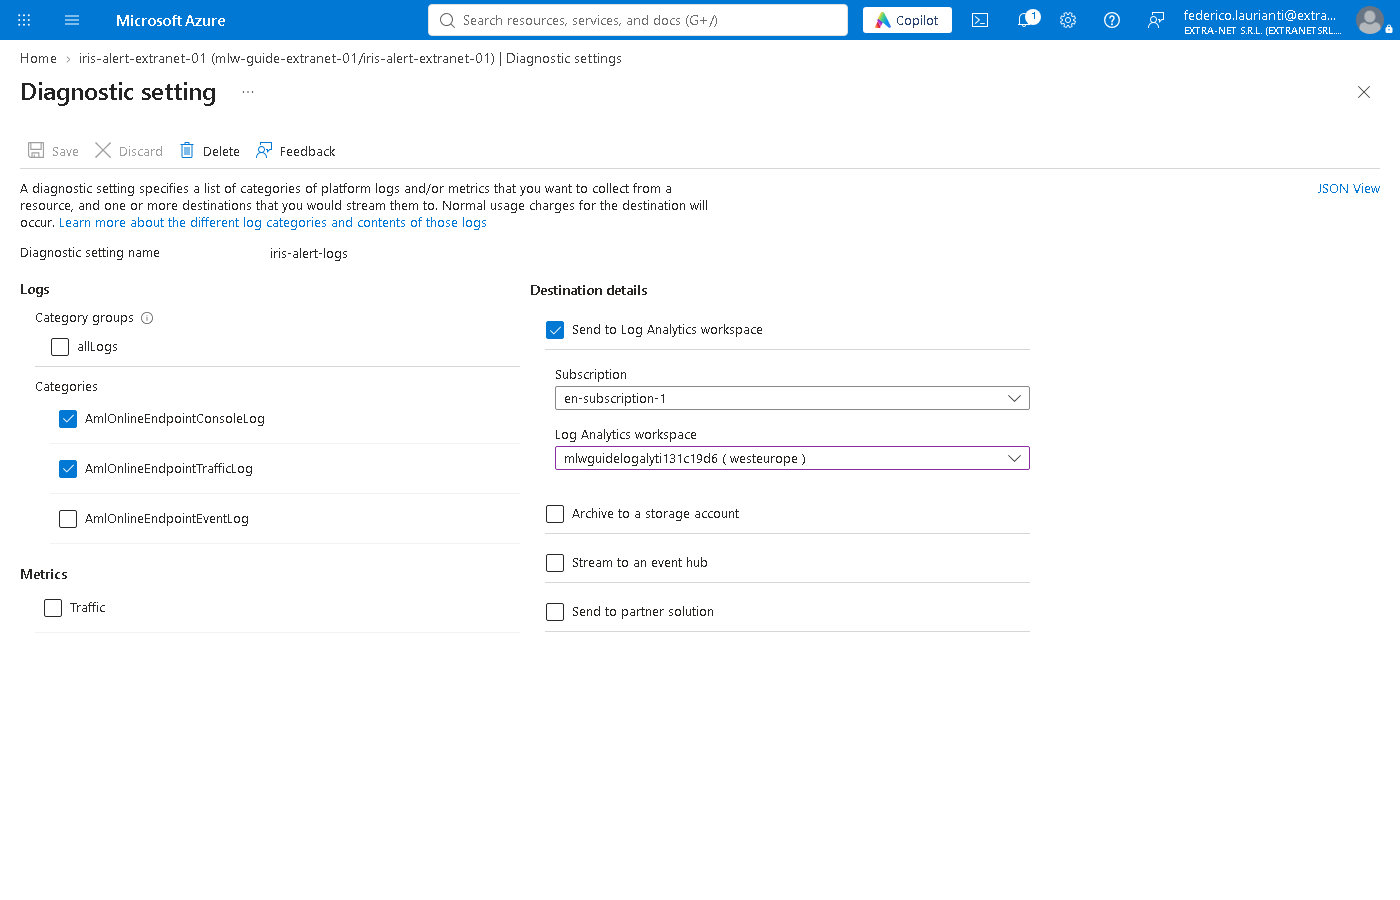
Press Save. AmlOnlineEndpointConsoleLog collects what the model writes, errors included; AmlOnlineEndpointTrafficLog one row per request, with the response code.
The alert rule
3. Choose the signal
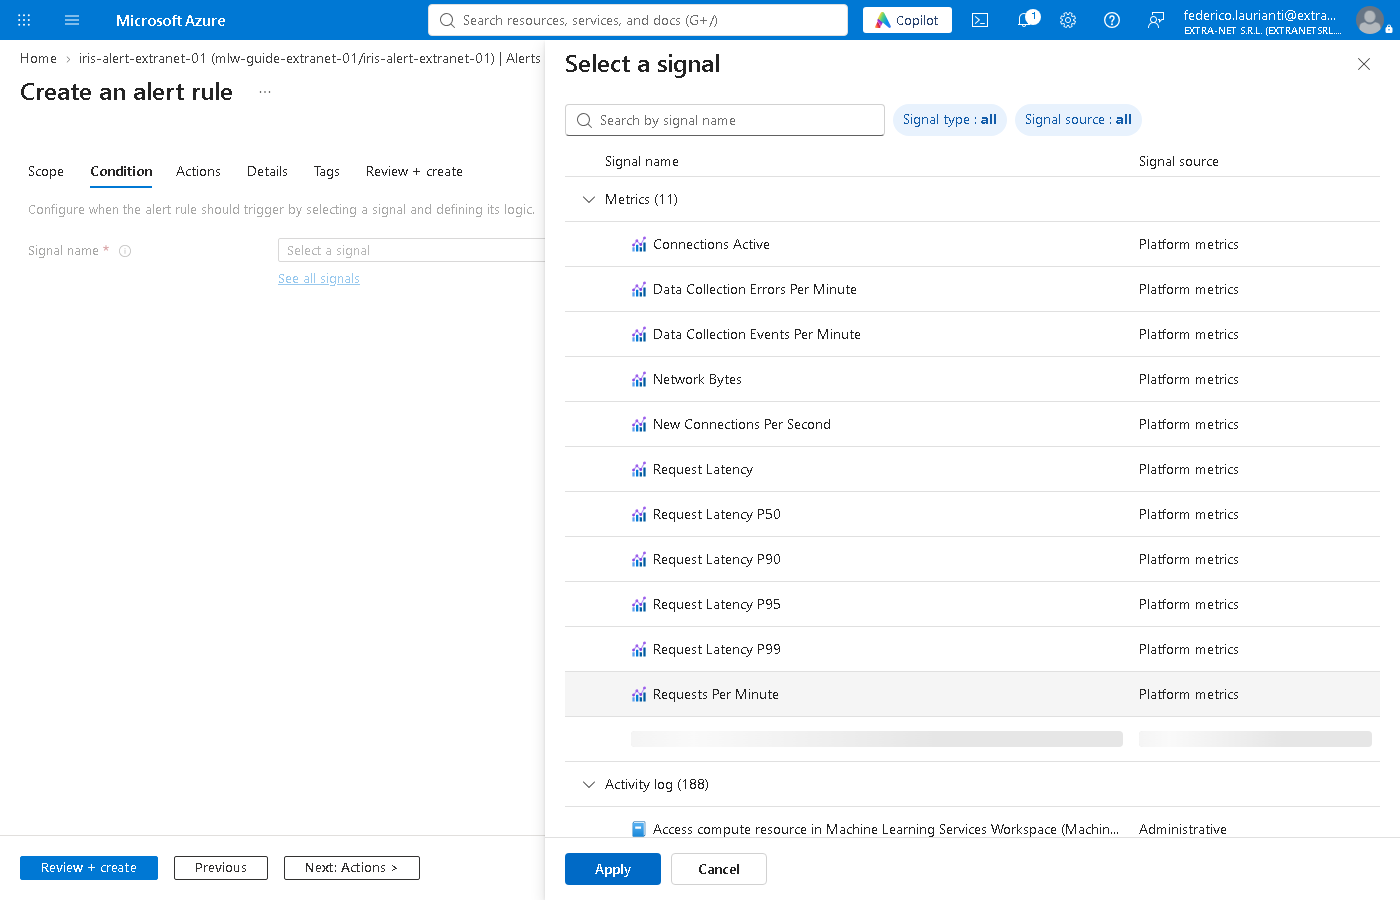
In the endpoint menu press Monitoring > Alerts > Create alert rule. In the list of signals choose Requests Per Minute and press Apply.
4. Set the condition
Fill in:
- Threshold:
10 - Dimension name: Status Code Class
- Dimension values:
4xx - Include all future values: off
Leave the rest as proposed: average greater than the threshold, checked every minute over the last 5.
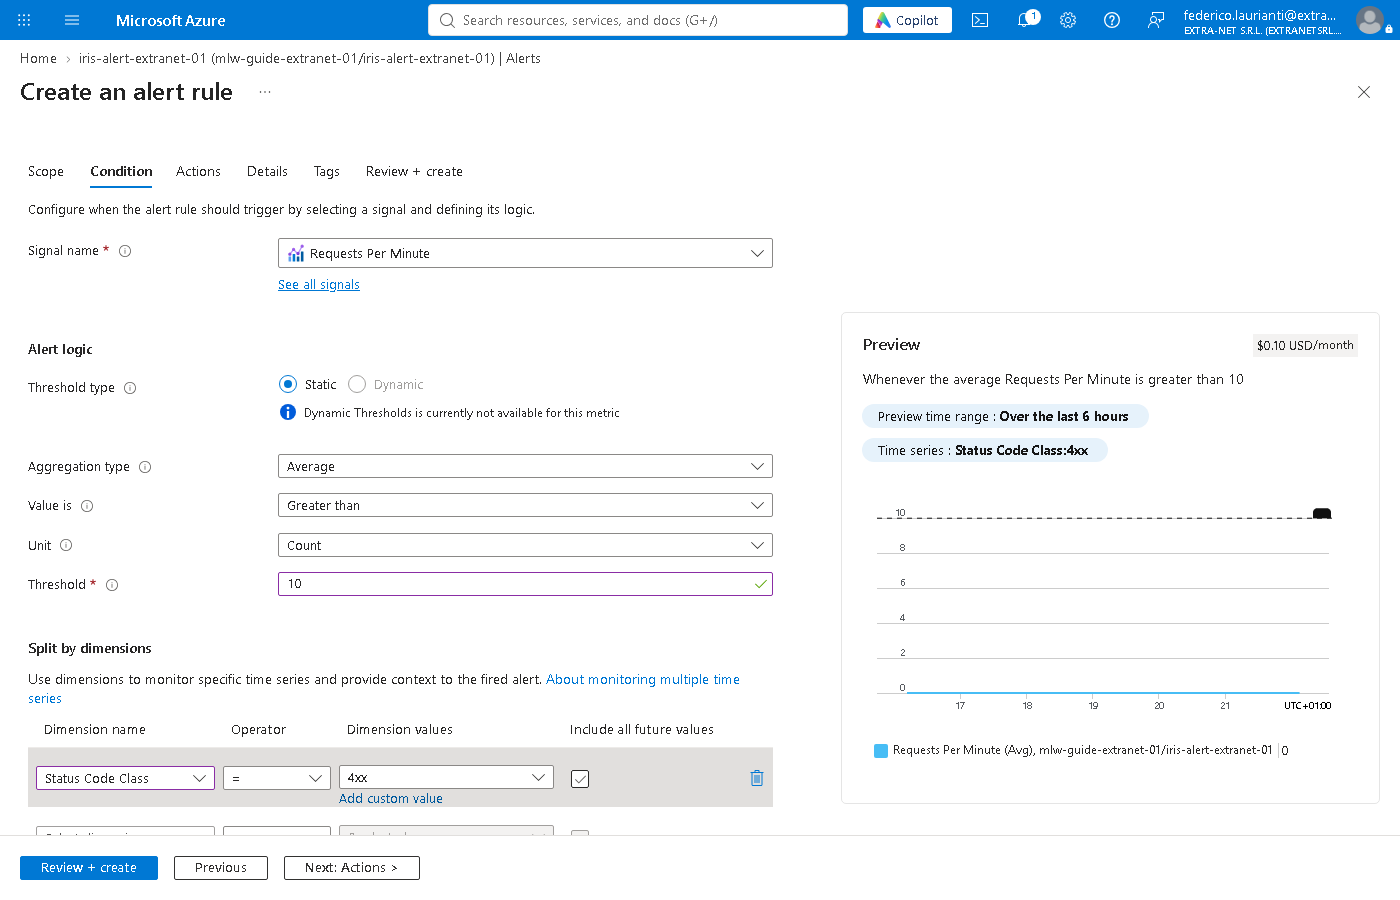
Without the dimension the rule would also count the correct responses. In the test the 4xx value was already in the list because the endpoint had answered with an error; if it is not there, write it with Add custom value.
5. Create the action group
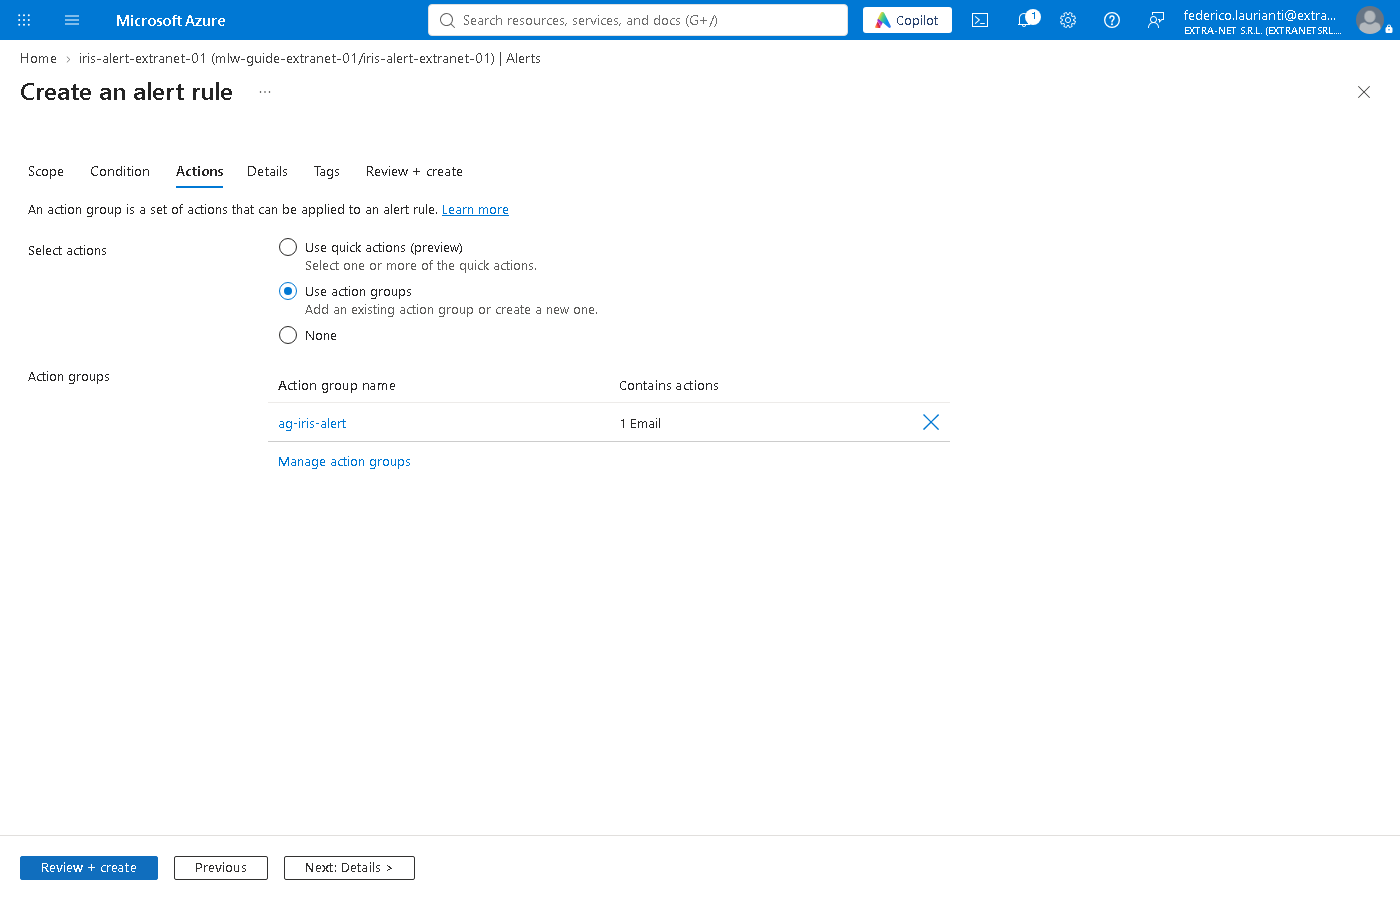
Press Next: Actions, then Select action groups > Create action group and fill in:
- Resource group:
rg-guide-ml-01 - Action group name:
ag-iris-alert - Display name:
iris-alert, at most 12 characters
Press Next: Notifications. In Notification type choose Email/SMS message/Push/Voice, tick Email, write the address that receives the alerts and press OK. In Name write email. The portal warns that a new address first receives a verification email.
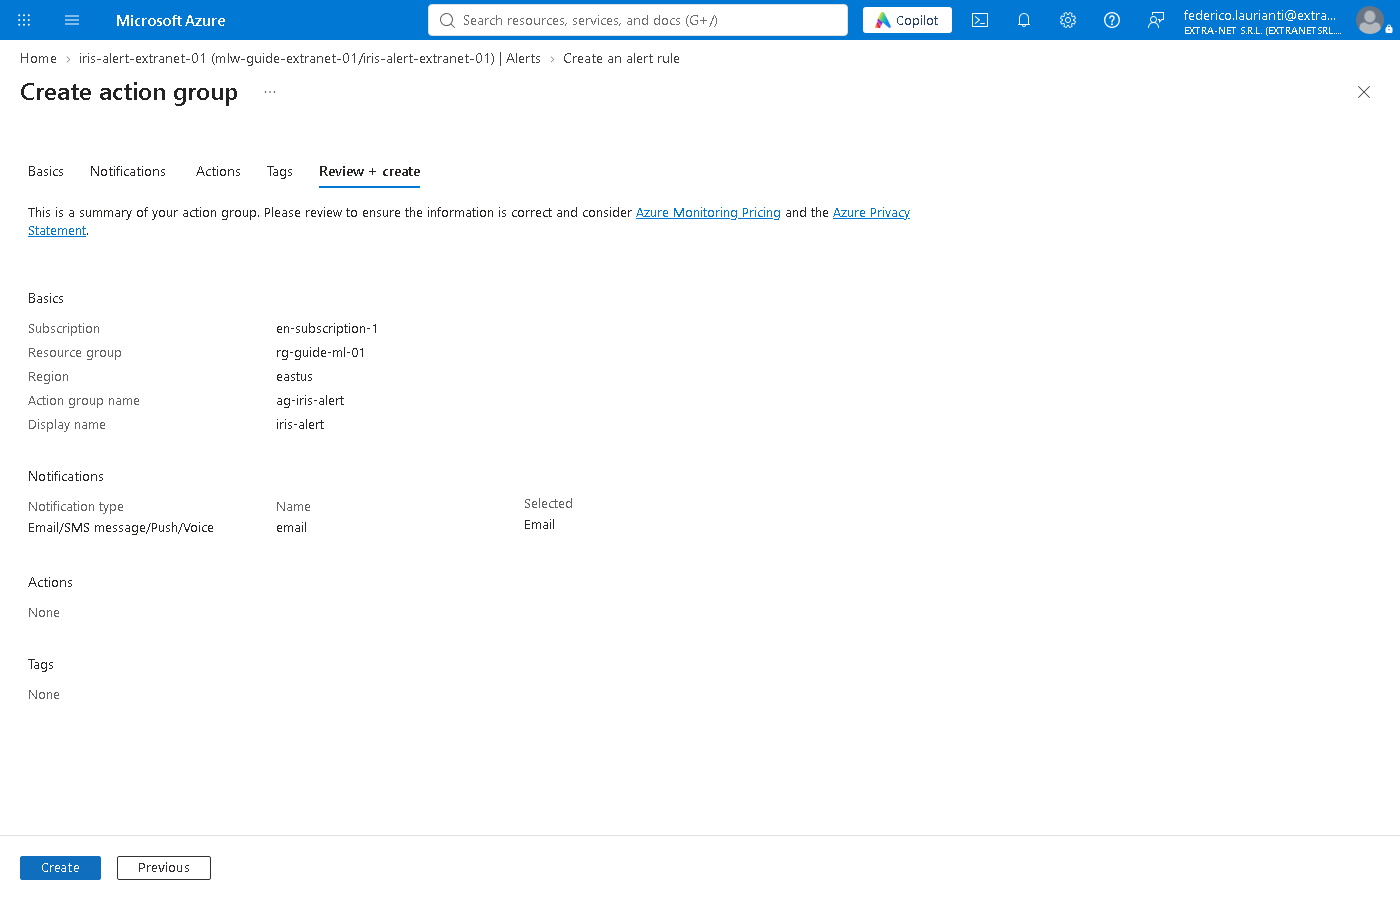
Press Review + create and Create. The group appears attached to the rule.
6. Name the rule
Press Next: Details and in Alert rule name write iris-errori-4xx. Leave Severity at 3 - Informational.
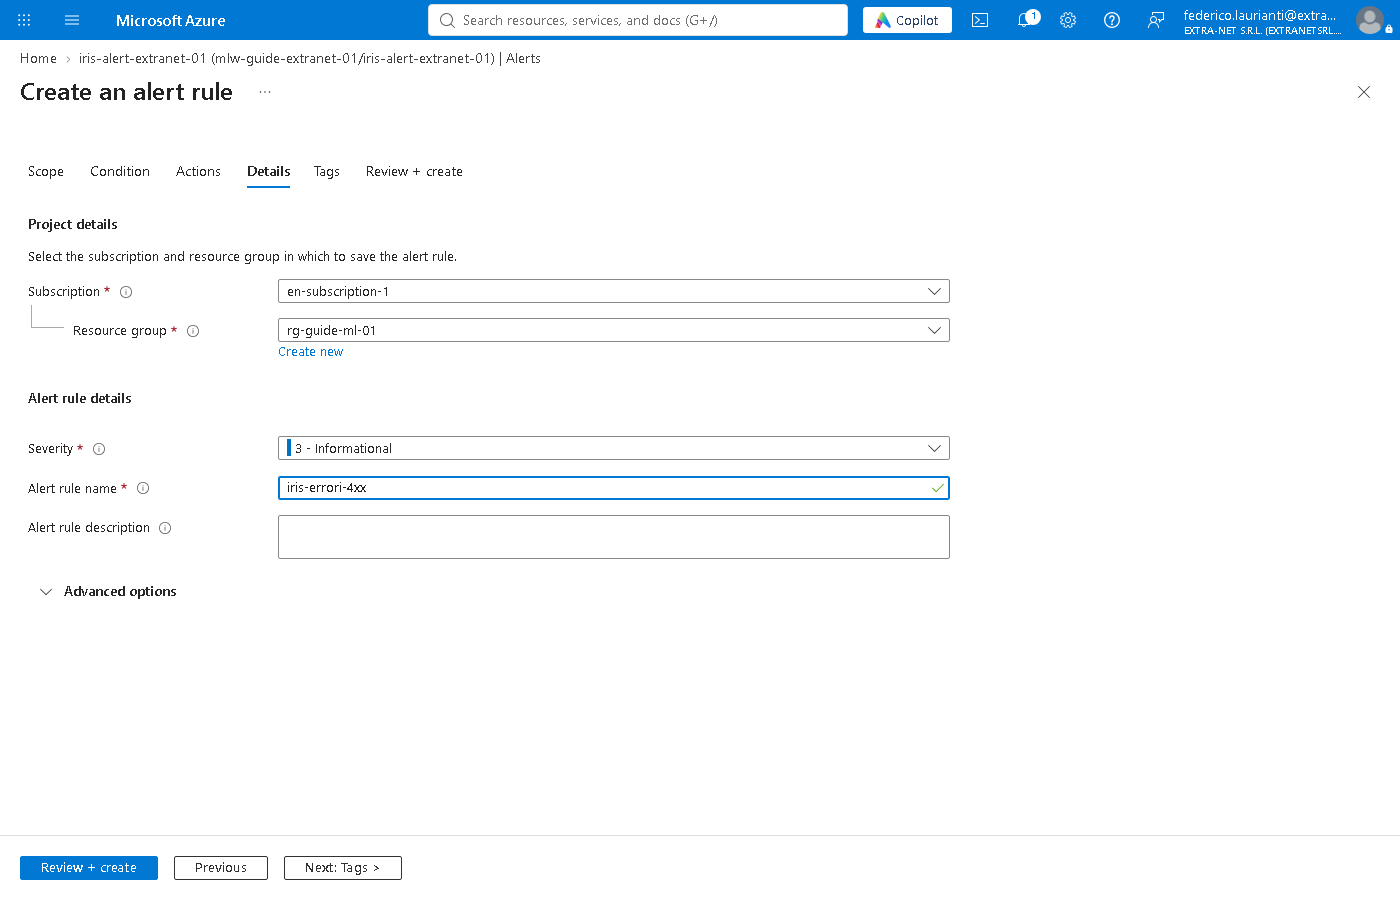
Press Review + create and Create.
The incident
7. Create the console
dotnet new console -n iris-alert
cd iris-alert
Replace Program.cs. For 10 minutes it sends one request a second and at the end counts the responses by code. With the broken argument it imitates a client with a defect: it sends three measures instead of four.
using System.Net.Http.Headers;
using System.Net.Http.Json;

string scoringUri = Environment.GetEnvironmentVariable("SCORING_URI")!;
string key = Environment.GetEnvironmentVariable("ENDPOINT_KEY")!;
bool broken = args.Length > 0 && args[0] == "broken";

// a broken client sends three measures instead of four
string[] columns = broken
    ? ["sepal_length", "sepal_width", "petal_length"]
    : ["sepal_length", "sepal_width", "petal_length", "petal_width"];
double[] flower = broken ? [6.0, 2.9, 4.5] : [6.0, 2.9, 4.5, 1.5];

var body = new { input_data = new { columns, index = new[] { 0 }, data = new[] { flower } } };

using HttpClient http = new();
http.DefaultRequestHeaders.Authorization = new AuthenticationHeaderValue("Bearer", key);

Dictionary<int, int> count = [];
string lastError = "";
DateTime end = DateTime.UtcNow.AddMinutes(10);
while (DateTime.UtcNow < end)
{
    using HttpResponseMessage response = await http.PostAsJsonAsync(scoringUri, body);
    int code = (int)response.StatusCode;
    count[code] = count.GetValueOrDefault(code) + 1;
    if (!response.IsSuccessStatusCode)
    {
        lastError = await response.Content.ReadAsStringAsync();
    }
    await Task.Delay(1000);
}

foreach (int code in count.Keys.Order())
{
    Console.WriteLine($"{code}: {count[code]} responses");
}
if (lastError != "")
{
    Console.WriteLine($"last error: {lastError}");
}
8. Cause the errors
Set the two variables with the values copied in step 1 and start two consoles, in two terminals:
export SCORING_URI=https://iris-alert-extranet-01.westeurope.inference.ml.azure.com/score
export ENDPOINT_KEY=<key>
dotnet run
dotnet run -- brokenIn PowerShell the first two lines are $env:SCORING_URI = "..." and $env:ENDPOINT_KEY = "...". In the test, after 10 minutes:
200: 539 responses424: 536 responses
last error: {"message": "An unexpected error occurred in scoring script. Check the logs for more info."}The correct client always gets 200; the faulty one always 424, with a message that does not say the cause.
9. Look at the alert
In the test the alert fired 4 minutes after the consoles started. In the endpoint menu press Monitoring > Alerts: the rule shows Fired.
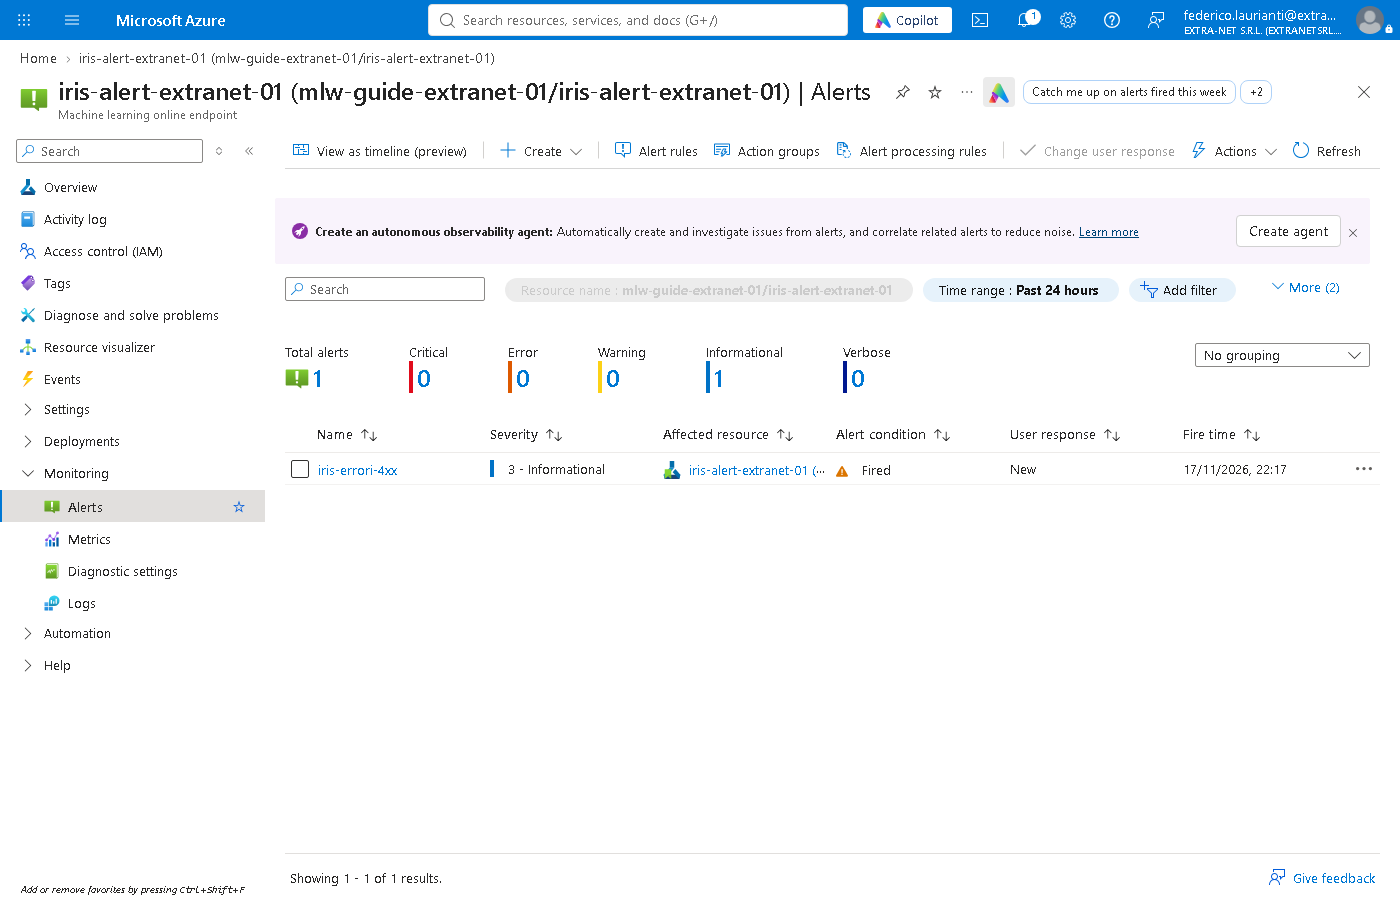
The address of step 5 receives an email with the name of the rule and the measured value.
10. Find the cause in the logs
In the endpoint menu press Monitoring > Logs. Close the welcome window and Queries hub; if the assistant opens, turn off Agent and confirm with Discard. Choose KQL mode instead of Simple mode, write the query and press Run:
AmlOnlineEndpointConsoleLog | where Message has "missing inputs" | summarize count() by Message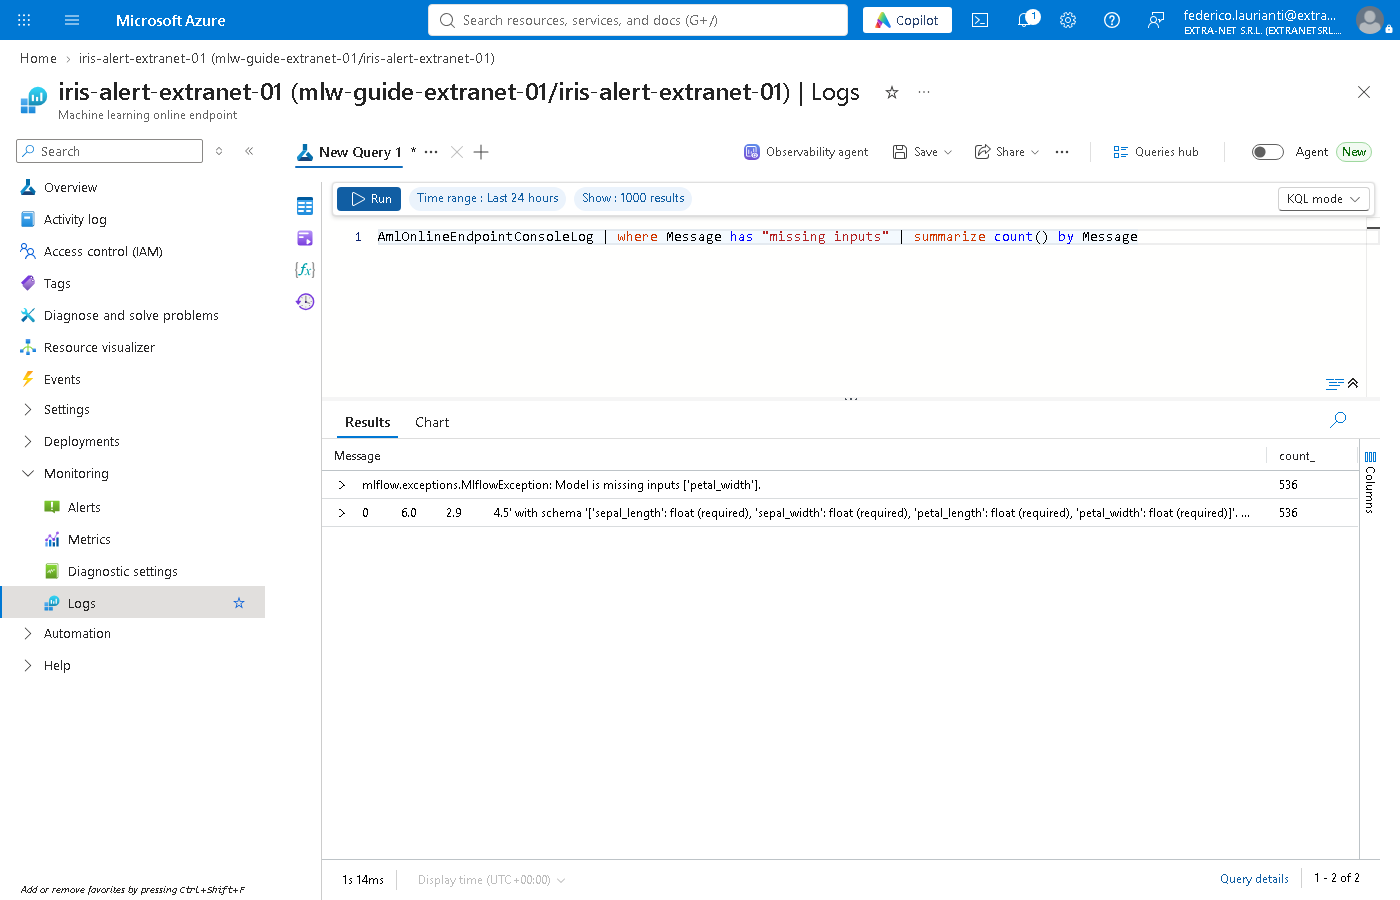
In the test the model wrote Model is missing inputs ['petal_width'] 536 times, as many as the 424 responses: the client sends three measures, the model wants four. The same search on AmlOnlineEndpointTrafficLog, grouped by ResponseCode and ModelStatusCode, gives 539 requests with 200 and 536 with 424, the endpoint code, and 500, the model code.
11. Close the incident
The fix is in the client: it has to send petal_width. Once the errors stop, Azure Monitor resolves the alert by itself: in the test 10 minutes after the last faulty request. In the test, after the resolution, Alerts no longer showed the alert.
Delete the resources
12. Delete the group
Delete the rg-guide-ml-01 group as in step 13 of the starting guide. The rule, the action group and the Log Analytics workspace go with it.
13. Permanently delete the workspace
On the portal search for Azure Machine Learning, press Recently deleted, choose the subscription and, in Location, West Europe. Tick mlw-guide-extranet-01 and press Permanently delete, as in step 14 of the starting guide. Without this step, for 14 days you cannot create a workspace with the same name.
Command names, screenshots and responses recorded on November 17, 2026, West Europe region, with .NET 10.